gnahnim
Nov 19, 2020
Writing Feedback / IELTS Task 1: The report, based on graphs, regarding US charity for children [3]
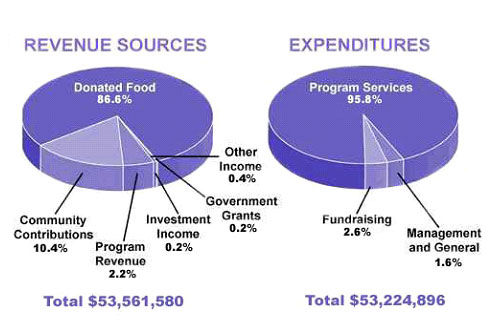
The pie chart gives information about the revenue sources and the expenditures of the USA children's charity in one year.
As can be seen from the graph, the revenue sources were more than the expenditures of about $336,000, of which, the majority of revenue sources was donated food but program services had a large portion in expenditures.
When it comes to revenue sources, donated food was eighth as much as the community contributions with almost 87% compared to 10.4%. It is clear from the chart that the program revenue had a small fraction with just 2.2%. Investment income and government grants occupied 0,2% each but the other income had a small portion with 0.4%.
As far as expenditures are concerned, a closer look at this pie chart revealed a significant majority with approximately 96%. Fundraising had a small percentage of 2.6%. On the other hand, the minimum expenditures were management and general with just 1.6%.
Revenue Sources and Expenditures of a USA Charity in one year.
The pie chart gives information about the revenue sources and the expenditures of the USA children's charity in one year.
As can be seen from the graph, the revenue sources were more than the expenditures of about $336,000, of which, the majority of revenue sources was donated food but program services had a large portion in expenditures.
When it comes to revenue sources, donated food was eighth as much as the community contributions with almost 87% compared to 10.4%. It is clear from the chart that the program revenue had a small fraction with just 2.2%. Investment income and government grants occupied 0,2% each but the other income had a small portion with 0.4%.
As far as expenditures are concerned, a closer look at this pie chart revealed a significant majority with approximately 96%. Fundraising had a small percentage of 2.6%. On the other hand, the minimum expenditures were management and general with just 1.6%.

REVENUESOURCESAND.jpg
