Writing Feedback /
THE GRAPH BELOW SHOWS ELECTRICITY PRODUCTION (IN TERAWATT HOURS) IN FRANCE BETWEEN 1982 AND 2012 [4]
electricity production in france by source
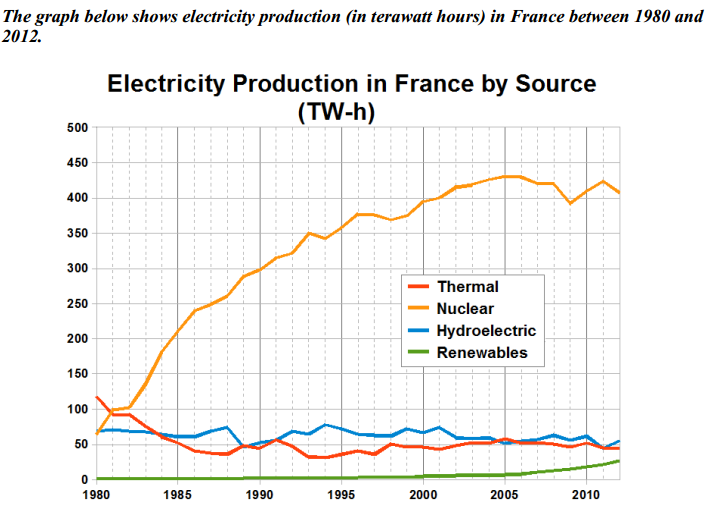
The given graph gives information on the amount of electricity produced by four distinct sources in France over a period of 32 years starting from 1980.
It is clear that while the figures for nuclear and renewables power experienced an upward trend, the opposite was true for that for thermal and hydroelectric. Also, nuclear was the most popular means of electricity generation.
As can be seen from the graph, the year 1980 saw no disparity between the figures for nuclear and hydroelectric power, which was around 70 Tw-h. For the next 25 yeas, the amount of electricity generated by nuclear increased significantly to reach a peak at about 430 Tw-h in 2005 before ending at 400 Tw-h in 2012. On the other hand, the figure for hydroelectric fluctuated for most of the period and decreased to approximately 52 Tw-h by 2012.
Standing at 110 Tw-h in 1980, thermal power provided a much higher amount of electricity than that of renewables which failed to register anything. From the year 1980 onwards, the amount of electricity produced by thermal power palpitated slightly before declining to 50 Tw-h at the end of the period. In contrast, the figure for electricity generated by renewables experienced a level-off from the year 1980 to 2000, but later upsurged to 10 Tw-h in 2012.

PhantichIELTSWrit.png

