Writing Feedback /
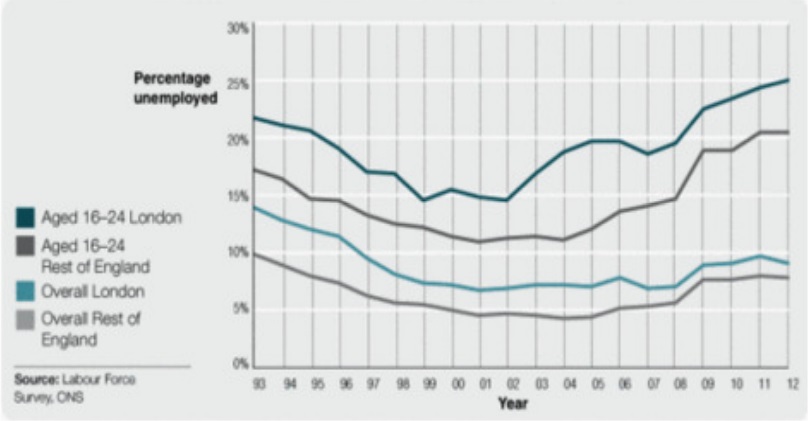
The graph below shows changes in young adult unemployment rates in England between 1993 and 2012. [3]
the percentage of people without job - London and rest of England
The line graph compares the level of people who are out of work in 4 groups of London and England during the period from 1993 to 2012.
Overall, it is clear that the proportion of jobless people decreased from 1990 to 2002. Besides, the rate of between job young man is higher than overall.
In 1993, the levels of unemployment people aged 16-24 were around 22% and the figure for those living outside of London was 5% smaller, at 18%. Whiles level of jobless people fall down significantly during 10 years, the trend for higher levels in London and among young adults continued.
From 2002, there was an upward trend in the level of jobless young people in England and London. The proportion of those rose dramatically by around 20% in both. However, the rest people of London and people live outside London without work remained below 10%

1.jpg

