Writing Feedback /
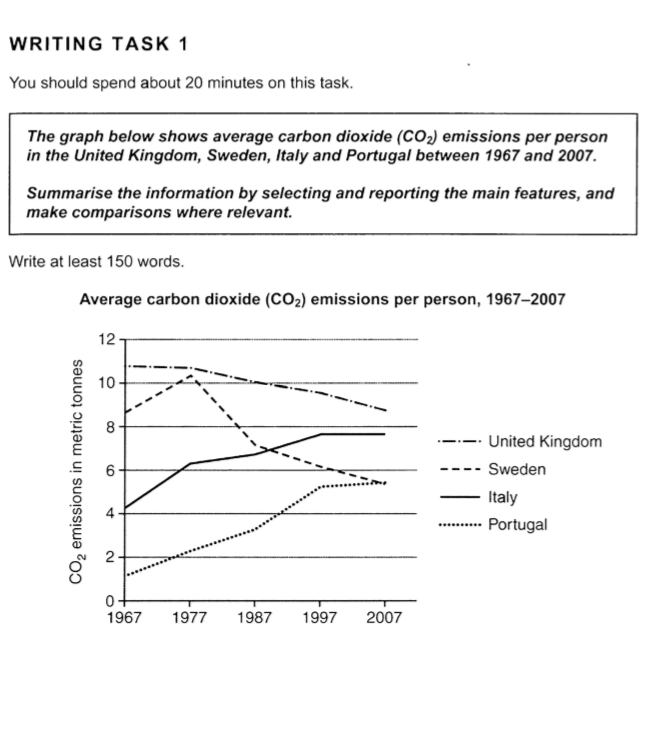
The graph illustrates carbon dioxide emitted per person on average, in four different countries [2]
IELTS 1 - CO2 emissions per person
The graph below shows average carbon dioxide (CO2) emissions per person in the United Kingdom,Sweden,Italy and Portugal between
1967 and 2007.
Summarise the information by selecting and reporting the main features,and make comparisons where relevant.The graph illustrates carbon dioxide emitted per person on average in four different countries(UK,Sweden,Italy and Portugal) from 1967 to 2007,and it is measured in metric tonnes.
Generally,it can be seen that in the UK and Sweden,the average amount of CO2 emitted per person saw an overall downward trend,which,conversely,rised in Italy and Portugal.
To be more specific,in the UK,starting at around 11,the number stayed constant in the first ten years before it saw slight but consistent drop from 1977 to 2007,when it reached the lowest level ,at just below 9 metric tonnes.By comparison with the situation in the UK,in Sweden,despite the fact that the number peaked at over 10 in 1977 after commencing with approximately 9 metric tonnes in 1967,it dropped significantly to 7,and after that,the trend slowed down and hit a low of 6 in 2007.
However,there was an inverse trend in Italy and Portugal.The average CO2 emissions per person increased from 4 in 1967 to over 7.5 in 1997 before staying stable in the next ten years.The figure for that in Portugal had kept rising from 1967 ,at 1,to 1997,at 5,when it began to go up slightly and finally reached 5.5,exceeding the number of Sweden in 2007.
--------------------------------------------------------------
Please feel free to comment and if so, you can give me a band score. Thx!
Please contact us directly: essayforum.com@gmail.com for a band score.
Screenshot17.png

