linsielee
Apr 27, 2021
Writing Feedback / Different proportions of energy production sources in two years 1995 and 2005. [3]
The given pie charts compare the percentages of different kinds of energy production between two years: 1995 and 2005.
It can be seen obviously in the charts that the energy produced from two sources namely coal and gas made up the largest share in both years, while the figures for nuclear and other energy production were the smallest.
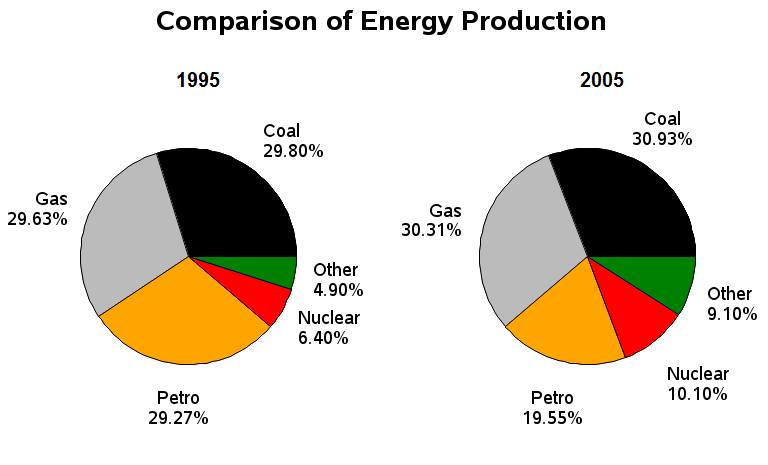
In detail, the energy produced from coal accounted for 29.80% of the total energy production, which was the highest proportion in 1995, and this figure underwent a slight increase to 30.93% in 2005. Similarly, the second-largest percentage was accounted for by Gas in both years, at 29.63% in 1995 and this proportion increased slightly by nearly 1% to 30.31% in 2005. The figures for nuclear and other energy production were much lower, accounted for 6.40% and 4.90% in 1995. These proportions experienced a modest increase of about 5% to 10.10% and 9.10% in 2005. However, they were still 2 sources that made up the smallest share in both years. In contrast, the percentage of Petrol underwent a reverse trend. The energy produced from Petrol accounted for 29.27% in 1995 but decreased sharply by nearly 10% to 19.55 in 2005
Comparison of energy production (pie charts)
The given pie charts compare the percentages of different kinds of energy production between two years: 1995 and 2005.
It can be seen obviously in the charts that the energy produced from two sources namely coal and gas made up the largest share in both years, while the figures for nuclear and other energy production were the smallest.
In detail, the energy produced from coal accounted for 29.80% of the total energy production, which was the highest proportion in 1995, and this figure underwent a slight increase to 30.93% in 2005. Similarly, the second-largest percentage was accounted for by Gas in both years, at 29.63% in 1995 and this proportion increased slightly by nearly 1% to 30.31% in 2005. The figures for nuclear and other energy production were much lower, accounted for 6.40% and 4.90% in 1995. These proportions experienced a modest increase of about 5% to 10.10% and 9.10% in 2005. However, they were still 2 sources that made up the smallest share in both years. In contrast, the percentage of Petrol underwent a reverse trend. The energy produced from Petrol accounted for 29.27% in 1995 but decreased sharply by nearly 10% to 19.55 in 2005

Piechart.jpg
