zenosyne719
May 31, 2021
Writing Feedback / IELTS Writing Task 1 - Percentages of people living in the towns and cities in 4 different countries [5]
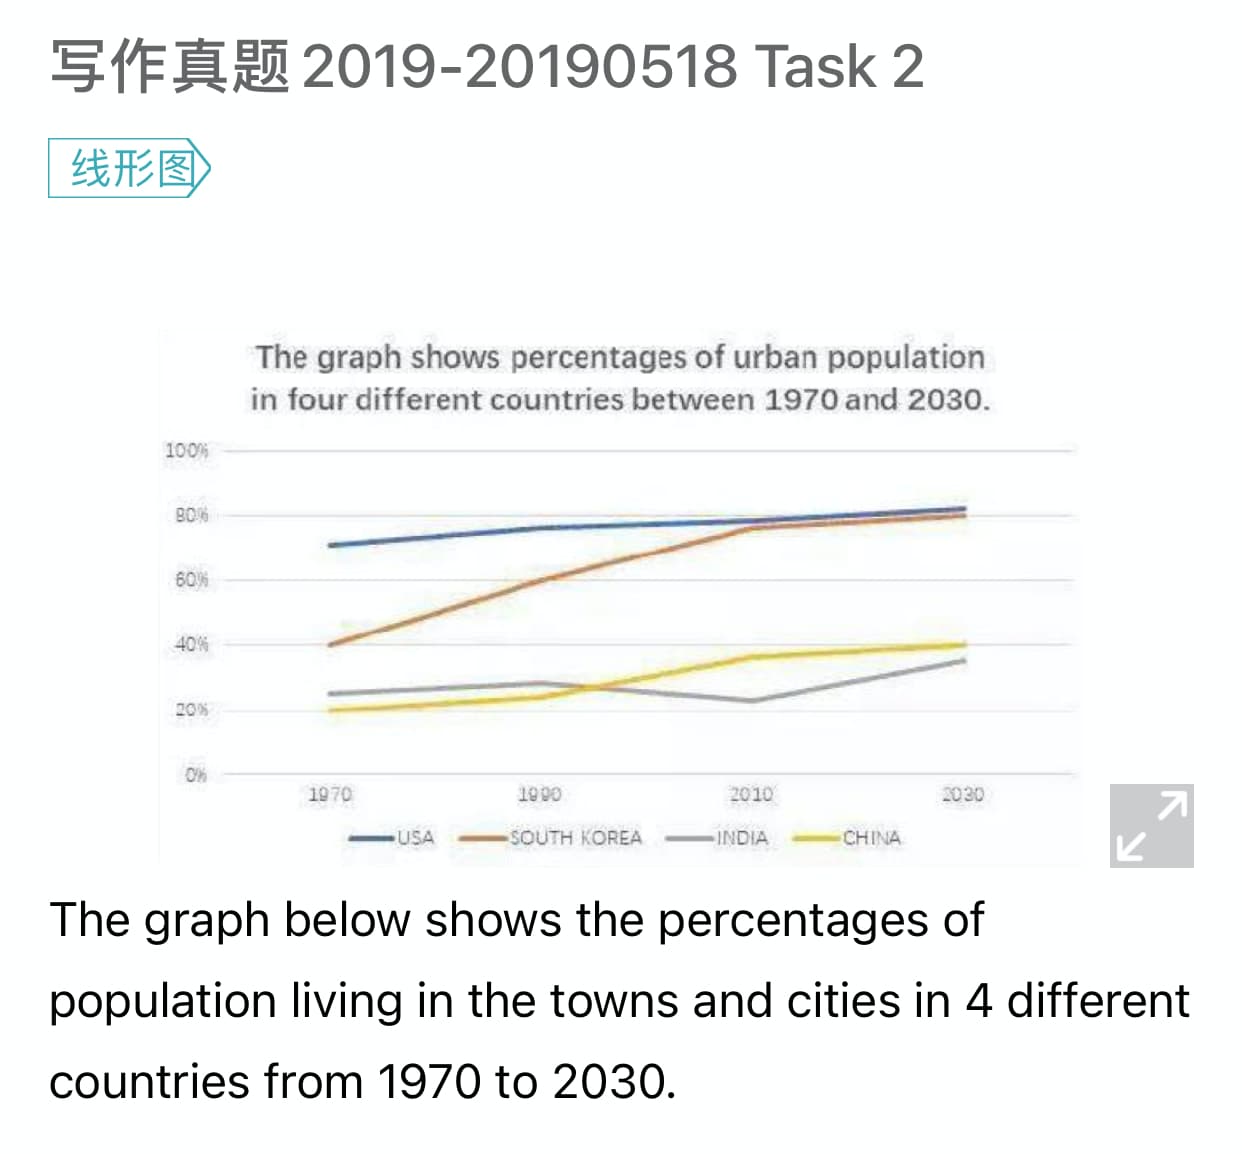
The line graph provided illustrates the total percentage of the population living in urban areas in four countries between 1970 and 2030.
Over the period shown, it is clear that three countries had an increasing trend in population living in cities and towns except for India, which had a temporary fall between 1990 and 2010. South Korea had experienced the fastest growth in urbanisation, and the USA remained stable in the past sixty years.
In 1997, the proportion of people living in urban areas in China was about 20%, and the data of India was close with China. The figure for the USA and South Korea were higher, at about 65% and 40% respectively. Between 1990 to 2010, the graph of China had surpassed that of India, with a rising trend in China and a declining trend of India.
From 2010, South Korea had narrowed down their gap with the USA, both were just under 80%. It was also in 2010 that China had a marked increase from around 22% to nearly 40%.
urban population numbers
The line graph provided illustrates the total percentage of the population living in urban areas in four countries between 1970 and 2030.
Over the period shown, it is clear that three countries had an increasing trend in population living in cities and towns except for India, which had a temporary fall between 1990 and 2010. South Korea had experienced the fastest growth in urbanisation, and the USA remained stable in the past sixty years.
In 1997, the proportion of people living in urban areas in China was about 20%, and the data of India was close with China. The figure for the USA and South Korea were higher, at about 65% and 40% respectively. Between 1990 to 2010, the graph of China had surpassed that of India, with a rising trend in China and a declining trend of India.
From 2010, South Korea had narrowed down their gap with the USA, both were just under 80%. It was also in 2010 that China had a marked increase from around 22% to nearly 40%.

IMG_0DE1993DC6E71.j.jpg
