reginaphalangee
Jun 13, 2021
Writing Feedback / The bar chart compares the number of crimes in five different countries of the world (1930-1980) [2]
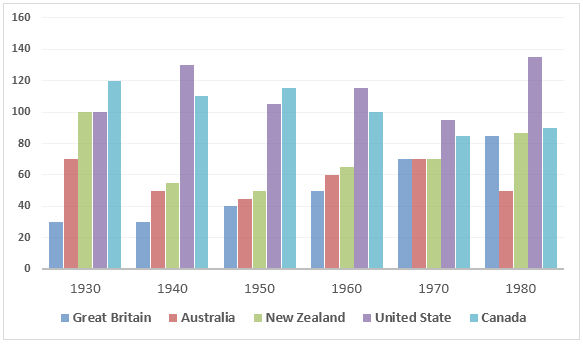
The chart below shows the figures (in thousand) for imprisonment in five countries between 1930 and 1980.
The bar chart compares the number of crimes who were thrown in jail in five different countries of the world over a 50-year period starting from 1930.
As can be seen from the chart, all the nations' figures tended to decline during the period, except for America and Great Britain.
In 1930, nearly 100 000 cases of captivity took place in the United State, which was more than a five fold of that in Britain. Despite some fluctuations, the next 50 years witnessed a dramatic increase of 40 000 incidents in America, while the data of Britain grew gradually to 50 000 cases within the same period. Moreover, 1980 saw the largest figure of imprisonment in the United State, at approximately 140 000 cases recorded.
Considering the 3 remaining countries, Canada used to have the highest statistics with 120 000 cases in 1930, while Australia had only about 70 000 at the same time. From 1940 onwards, both Canada and Australia's data fluctuated considerably, then ended at nearly 100 000 and 60 000 cases respectively.
Besides, a remarkable fall to just slightly over 40 000 incidents was found in the figure of New Zealand during the first 20 years, before it climbed back to 90 000 at the end of the period.
IELTS WRITING TASK 1: IMPRISONMENT
The chart below shows the figures (in thousand) for imprisonment in five countries between 1930 and 1980.
The bar chart compares the number of crimes who were thrown in jail in five different countries of the world over a 50-year period starting from 1930.
As can be seen from the chart, all the nations' figures tended to decline during the period, except for America and Great Britain.
In 1930, nearly 100 000 cases of captivity took place in the United State, which was more than a five fold of that in Britain. Despite some fluctuations, the next 50 years witnessed a dramatic increase of 40 000 incidents in America, while the data of Britain grew gradually to 50 000 cases within the same period. Moreover, 1980 saw the largest figure of imprisonment in the United State, at approximately 140 000 cases recorded.
Considering the 3 remaining countries, Canada used to have the highest statistics with 120 000 cases in 1930, while Australia had only about 70 000 at the same time. From 1940 onwards, both Canada and Australia's data fluctuated considerably, then ended at nearly 100 000 and 60 000 cases respectively.
Besides, a remarkable fall to just slightly over 40 000 incidents was found in the figure of New Zealand during the first 20 years, before it climbed back to 90 000 at the end of the period.

CDBD34B29D594C779.png
