Writing Feedback /
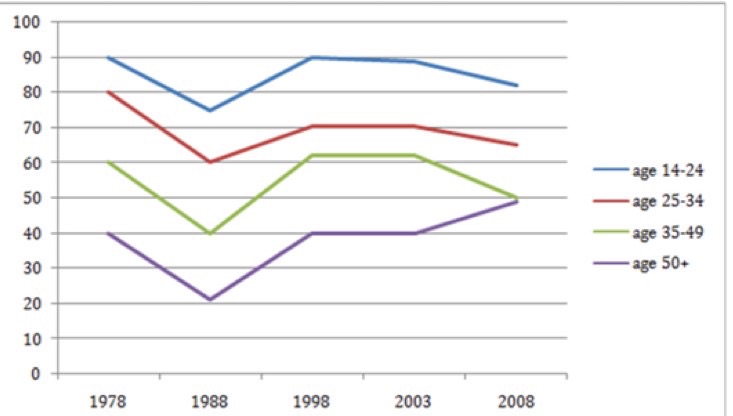
IELTS Task 1 The line graph illustrates the percentage of different age groups of cinema visitors [4]
cinema visitors numbers
IELTS Task 1 The line graph shows the percentage of different age groups of cinema visitors in a paticular country.
The line graph illustrates the guests of four indivisual groups divided by their age in a certain country during five different years. Over all, the youngest group which represnts age 14 to 24 was the majority of the visitors of the movie theater over 1978 to 2008. In contrast, the oldest group was not really into watching movies in the cinema during the period.
Looking in the data in more detail, the people in 1988 were less likely to go watching movies comparing to whom in 1978. This led to a massive decrease of the number of visitors. However, things had gotten better since 1998, more and more people were willing to go to the theater. Consequently, the figure shows a noticeable growth. During 1998 to 2003, the number of clients of the cinema remained steady. Finally in 2008, the oldest group which stands for people over 50 years old had a slightly rise while the others fell.
To all who clicked into this page, this is my first attempt to practice IELTS writing test. I'm still learning and practicing to fulfill my goal. Thanks for your advice :D.

S__10788898.jpg

