melanieng
Jul 8, 2021
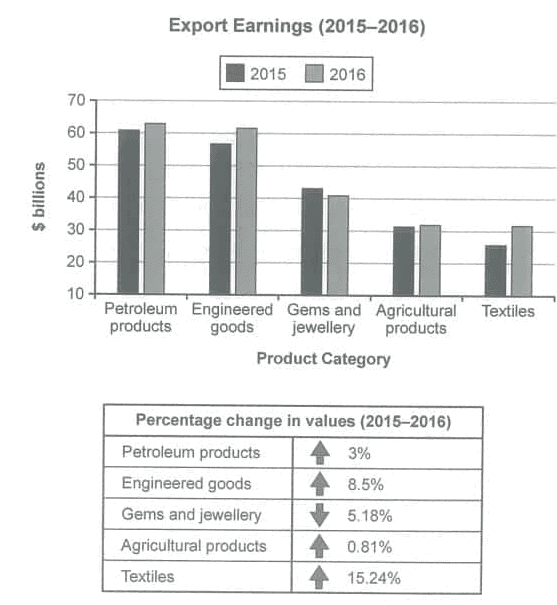
Writing Feedback / The chart below shows the value of one country's exports in various categories during 2015 and 2016. [2]
The bar chart and table compare the export value in five given categories between 2015 and 2016.
It can be seen that export value an upward trend over period time. Moreover, petroleum products and engineered goods accout for largest proportion of export earnings i 2015 and 2016.
The country's most money-making which is petroleums product. It was moderate increase, from 60 billion to approxiamately 63 billion, it was 3% rise. A similar growth with engineered goods-at 8.5%.
On behalf of various industries, germs and jewellery took the lowest rank. The amount of money which were from those felt down dramatically, from 43 billion to 40 billion in a year, while the export earnings of textiles climb rapidly to over 30 billion- at 15.8%. In contrast, the agricultural product went up slightly, about 30 billion.
The charts give the information about export value in various industries in a nation from 2015 to 2016.
export earnings (2015-2016)
The bar chart and table compare the export value in five given categories between 2015 and 2016.
It can be seen that export value an upward trend over period time. Moreover, petroleum products and engineered goods accout for largest proportion of export earnings i 2015 and 2016.
The country's most money-making which is petroleums product. It was moderate increase, from 60 billion to approxiamately 63 billion, it was 3% rise. A similar growth with engineered goods-at 8.5%.
On behalf of various industries, germs and jewellery took the lowest rank. The amount of money which were from those felt down dramatically, from 43 billion to 40 billion in a year, while the export earnings of textiles climb rapidly to over 30 billion- at 15.8%. In contrast, the agricultural product went up slightly, about 30 billion.
The charts give the information about export value in various industries in a nation from 2015 to 2016.

08210D0FCB564A069.png
