Writing Feedback /
The amount of money which was earned by three different products over three years, starting in 2000 [2]
products profits analysis
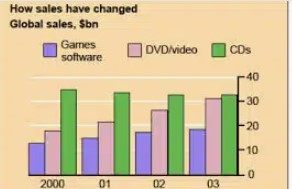
The bar chart illustrates the amount of money which was earned by three different products over three years, starting in 2000.
Broadly speaking, it can be seen that sales of three products increased during the period given with an exception of CDs sales, which dropped between 2000 and 2003.
As is seen from the chart, it is noticeable that a high amount of money was earned by CDs products, at over 35 billion dollars in 2000. The figure had a slow decrease of approximately 33 billion dollars in 2001. Sales of CDs gradually fall to just above 30 million dollars in 2002 and this figure maintained the same level at the end of the shown period. Conversely, sales of DVD or videos were less over 10 billion dollars compared to CD sales steeply rose from around 25 billion dollars to 30 billion dollars in 2003, which was almost the same as the value of CD sales.
Similarly, the amount of money which was gained by sales of games software stood at approximately 15 billion dollars in 2000. After that there was a consistent raise of 15 billion dollars in 2002. In 2003,near 18 billion dollars were attained by sales of games software.

Annotation2021080.jpg

