Lillingg
Oct 24, 2023
Writing Feedback / IELTS task 1: The bar chart compares five countries in terms of movies' production from 2007 to 2009 [2]
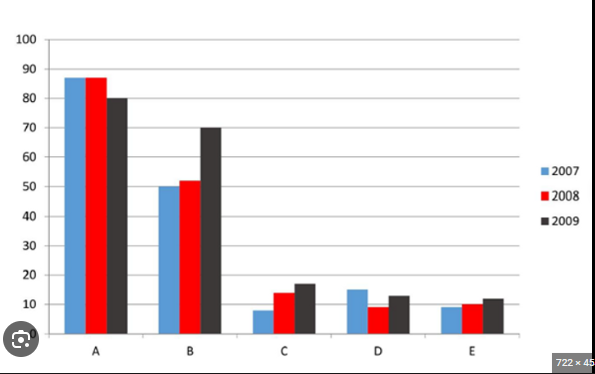
The bar chart compares five countries (country A, country B, country C, country D, and country E) in terms of movies' production from 2007 to 2009.
Generally, the numbers of movies were highest in country A, followed by country B, whereas the figures for the remaining countries were lower throughout. Additionally, there were upward trends in the data in country B, country C, and country E. Meanwhile, country A experienced a downward trend, and country D experienced a fluctuation over the years.
Looking first at countries A and B, in 2007, the former made the most films at around 86, while the latter had a lower starting point at 50. Then the data in country remained unchanged in the next year, before dropping a bit to 80 in 2009. In comparison, the figures for country B grew slightly by about 2 in 2008 and culminated at 70 at the end of the period. Despite the changes after three years, both countries A and B remained in the same position, with the former ranking first and the latter holding the second position.
Moreover, both country C and country E experienced a similarly gradual rising trend. Country C was in third place in 2007 with a starting point of approximately 8, slightly below that of country E (at roughly 9). Afterwards, the number in country C rose continuously and finished at around 15 in 2009, about 1.5 times higher than the data in country E. In contrast, the data in country D was inconsistent throughout, ranging from 9 to 15.
the number of films produced in five countries
The bar chart compares five countries (country A, country B, country C, country D, and country E) in terms of movies' production from 2007 to 2009.
Generally, the numbers of movies were highest in country A, followed by country B, whereas the figures for the remaining countries were lower throughout. Additionally, there were upward trends in the data in country B, country C, and country E. Meanwhile, country A experienced a downward trend, and country D experienced a fluctuation over the years.
Looking first at countries A and B, in 2007, the former made the most films at around 86, while the latter had a lower starting point at 50. Then the data in country remained unchanged in the next year, before dropping a bit to 80 in 2009. In comparison, the figures for country B grew slightly by about 2 in 2008 and culminated at 70 at the end of the period. Despite the changes after three years, both countries A and B remained in the same position, with the former ranking first and the latter holding the second position.
Moreover, both country C and country E experienced a similarly gradual rising trend. Country C was in third place in 2007 with a starting point of approximately 8, slightly below that of country E (at roughly 9). Afterwards, the number in country C rose continuously and finished at around 15 in 2009, about 1.5 times higher than the data in country E. In contrast, the data in country D was inconsistent throughout, ranging from 9 to 15.

Screenshot2023102.png
