Thnggg
Aug 7, 2021
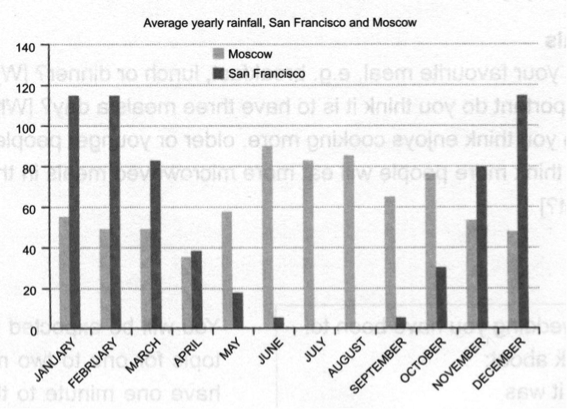
Writing Feedback / W task 1: The graph below shows average yearly rainfall in Moscow and San Francisco [2]
The bar chart below demonstrates the average amount of rainfall over the year in two different cities, Moscow and San Francisco.
Look at the graph, it is obviously seen that the rain season in Moscow occurs in the summer, while in San Francisco, it happens in the winter.
According to the figures, rainfall happens all year round in Moscow. At first, the rainfall amount witnesses a downward trend between January and April, from 58 millimeters to 48 millimeters, but then it increases significantly and reaches the peak at 90 millimeters in June notwithstanding. Afterward, the amount of rain sees a slow decline from 82 millimeters in July to 49 millimeters in December. Whereas there is a tiny increase exist in August and October.
On the contrary, San Francisco does not rain all year round. Moreover, the rainfall amount distributes unevenly, allocates particularly in December, January, and February at approximately 115 millimeters. In addition, there is no rainfall in either July or August.
rainfall NUMBERS IN TWO CITIES
The bar chart below demonstrates the average amount of rainfall over the year in two different cities, Moscow and San Francisco.
Look at the graph, it is obviously seen that the rain season in Moscow occurs in the summer, while in San Francisco, it happens in the winter.
According to the figures, rainfall happens all year round in Moscow. At first, the rainfall amount witnesses a downward trend between January and April, from 58 millimeters to 48 millimeters, but then it increases significantly and reaches the peak at 90 millimeters in June notwithstanding. Afterward, the amount of rain sees a slow decline from 82 millimeters in July to 49 millimeters in December. Whereas there is a tiny increase exist in August and October.
On the contrary, San Francisco does not rain all year round. Moreover, the rainfall amount distributes unevenly, allocates particularly in December, January, and February at approximately 115 millimeters. In addition, there is no rainfall in either July or August.

wenrct7fh56ck8kzzo94.png
