janeee
Aug 11, 2021
Writing Feedback / IELTS WRITING TASK 1: The graph shows the percentages of people going to cinemas in a country [6]
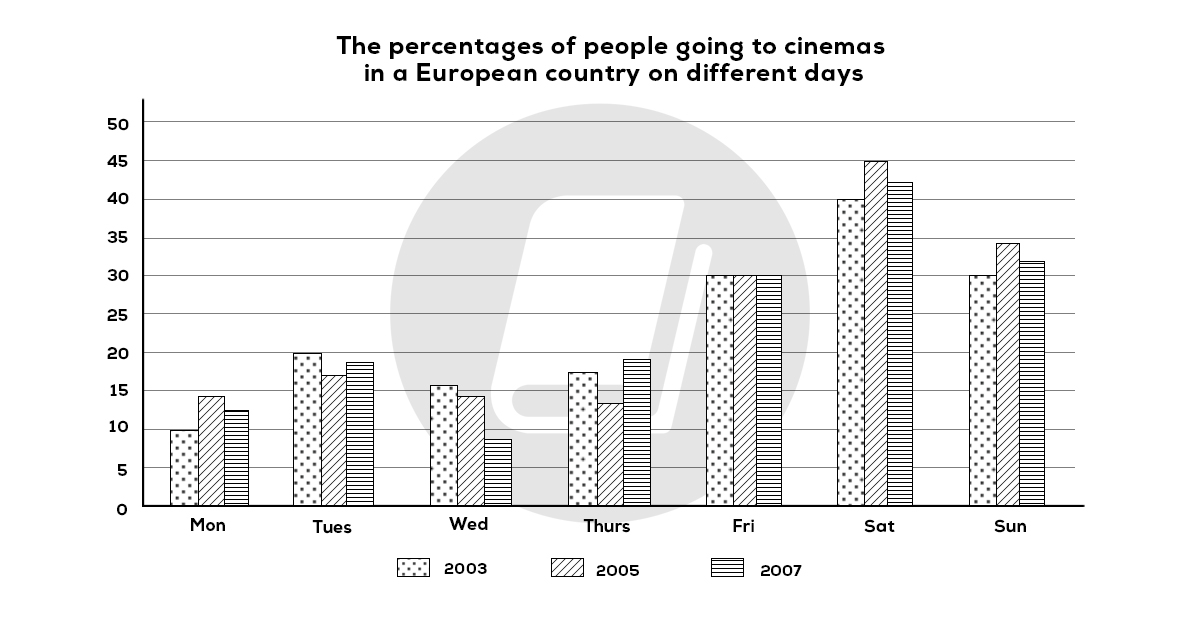
The bar chart compares the proportion of citizens from a European nation spending time at the cinemas during a week in 2003, 2005 and 2007..
It is clear that Saturday was the most favoured day to go to the cinemas in three given years. The percentage of European people arriving to the cinemas on Friday and weekends were higher than that on the other days of the week in three periods 2003, 2005 and 2007.
On the first four days of the week, the figure of cinema- goers in the three mentioned years experienced some fluctuations. In those four days, the percentage of citizens choosing to go to cinemas in that country had its peak at around 20% on Tuesday in three years, before witnessing a slight decrease on the next day by around 5% in 2003, 2005 and nearly 10% in 2007 respectively.
On Friday, after increasing remarkably, the figure for cinema visitors in three years in that country stood at 30%. In particular, Saturday had the highest proportion of movie-goers in three years among other days at 40%, 45% and about 43 % in 2003, 2005 and 2007 respectively. were about 10% higher than that Sunday
cinema-goers in three different years
The bar chart compares the proportion of citizens from a European nation spending time at the cinemas during a week in 2003, 2005 and 2007..
It is clear that Saturday was the most favoured day to go to the cinemas in three given years. The percentage of European people arriving to the cinemas on Friday and weekends were higher than that on the other days of the week in three periods 2003, 2005 and 2007.
On the first four days of the week, the figure of cinema- goers in the three mentioned years experienced some fluctuations. In those four days, the percentage of citizens choosing to go to cinemas in that country had its peak at around 20% on Tuesday in three years, before witnessing a slight decrease on the next day by around 5% in 2003, 2005 and nearly 10% in 2007 respectively.
On Friday, after increasing remarkably, the figure for cinema visitors in three years in that country stood at 30%. In particular, Saturday had the highest proportion of movie-goers in three years among other days at 40%, 45% and about 43 % in 2003, 2005 and 2007 respectively. were about 10% higher than that Sunday

detask110072021.j.jpg
