T007
Aug 14, 2021
Writing Feedback / IELTS Writing Task 1: The bar chart shows the percentage of elderly citizens in three countries... [2]
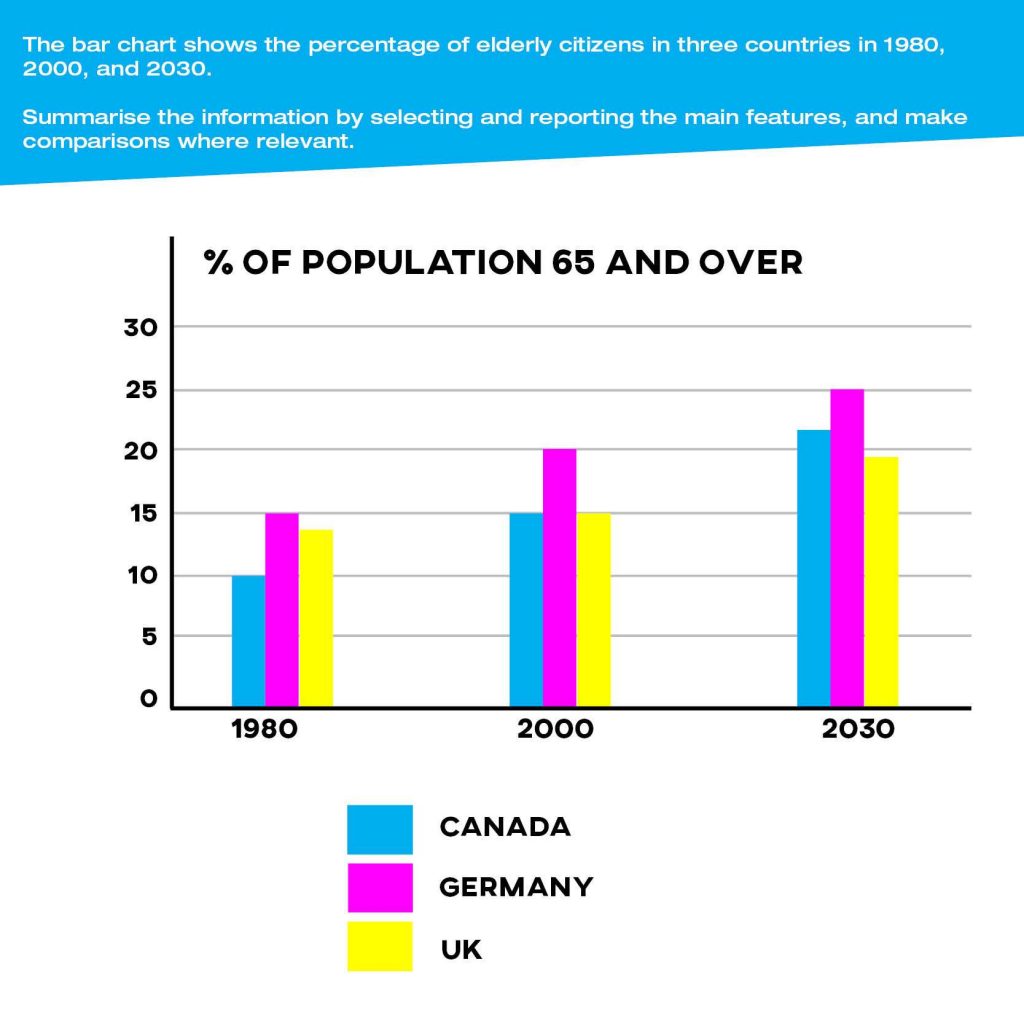
The chart illustrates the proportion of the ageing population in the UK, Germany, Canada in 3 different time periods.
Overall, the number of old citizens in three countries experienced a gradual upward trend over periods of time and it is predicted to continue increasing in the future. Moreover, it is noticeable that the rate of the elderly in Germany dominated the others in the past and expectations show it will still overwhelm.
In detail, the percentage of ageing people in Germany levelled off at 15% in 1980 and grew progressively to a fifth in 2000. Meanwhile, the figures of Canada and the UK stood at 10% and approximately 14% in the chart's first time period and both rose to 15% in the year 2000.
Anticipations reveal that there will be a 5% growth in the percentage of Germany's population aged 65 and over will peak at 25%. whereas the proportion of Canada is forecast to have a significant increase with 7% by 22% and will surpass that of the UK, which will plateau around 19% in 2030.
The bar chart shows the percentage of elderly citizens in 3 countries in 1980, 2000, 2030
The chart illustrates the proportion of the ageing population in the UK, Germany, Canada in 3 different time periods.
Overall, the number of old citizens in three countries experienced a gradual upward trend over periods of time and it is predicted to continue increasing in the future. Moreover, it is noticeable that the rate of the elderly in Germany dominated the others in the past and expectations show it will still overwhelm.
In detail, the percentage of ageing people in Germany levelled off at 15% in 1980 and grew progressively to a fifth in 2000. Meanwhile, the figures of Canada and the UK stood at 10% and approximately 14% in the chart's first time period and both rose to 15% in the year 2000.
Anticipations reveal that there will be a 5% growth in the percentage of Germany's population aged 65 and over will peak at 25%. whereas the proportion of Canada is forecast to have a significant increase with 7% by 22% and will surpass that of the UK, which will plateau around 19% in 2030.

ssccompressed8910.jpg
