BlluryFace
Dec 16, 2021
Writing Feedback / Two graphs: the number of train riders and the proportion of trains that run on time to the target [3]
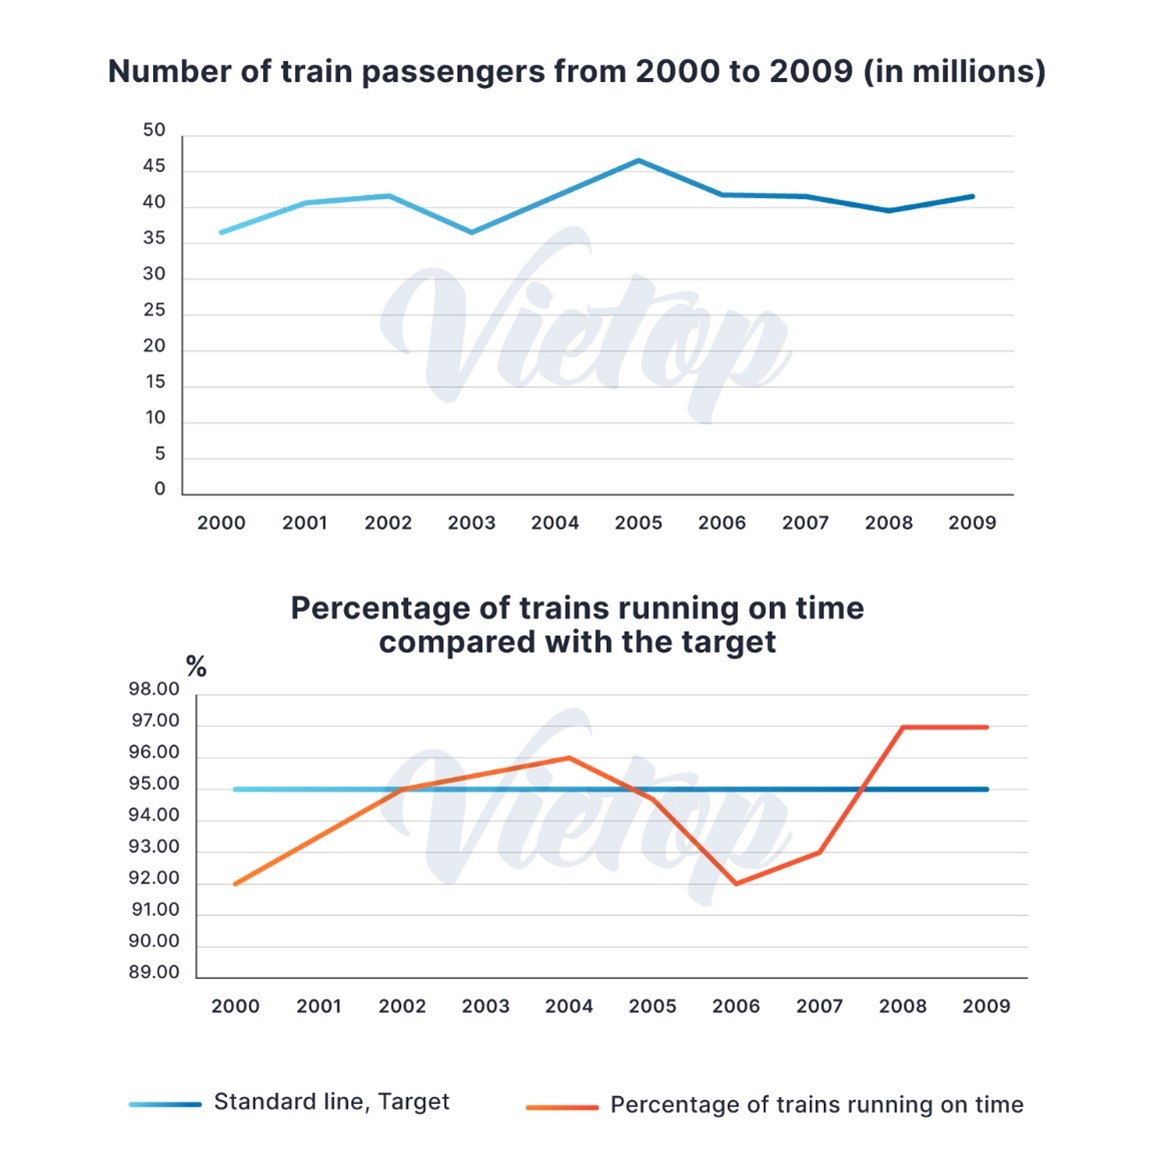
Question: The first graph shows the number of train passengers from 2000 to 2009; the second compares the percentage of trains running on time and target in the period.
My essay:
The line graph at the top depicts the number of train riders from 2000 to 2009 while the line graph below compares the proportion of trains that run on time to the target.
Overall, it is clear that the number of people who use trains remains relatively stable throughout the period. In addition, the percentage of trains that run punctually falls below the target most of the time.
The number of people using trains rose moderately from around 35 million to around 45 million passengers. In the following years, the figure fell slightly from 45 million to 40 million users then rose to just above 40 million users
Regarding the second line graph, the proportion of trains running on time rose considerably from 92% to 96% in 2004, rose above the target line. The figure then fell by 5% in 2006, which makes it below the target. The proportion of trains running on time rose above the target line again in 2008 at 97% then remain steady until the end of the period. (173 words)
IELTS Writing task 1 mixed
Question: The first graph shows the number of train passengers from 2000 to 2009; the second compares the percentage of trains running on time and target in the period.
My essay:
The line graph at the top depicts the number of train riders from 2000 to 2009 while the line graph below compares the proportion of trains that run on time to the target.
Overall, it is clear that the number of people who use trains remains relatively stable throughout the period. In addition, the percentage of trains that run punctually falls below the target most of the time.
The number of people using trains rose moderately from around 35 million to around 45 million passengers. In the following years, the figure fell slightly from 45 million to 40 million users then rose to just above 40 million users
Regarding the second line graph, the proportion of trains running on time rose considerably from 92% to 96% in 2004, rose above the target line. The figure then fell by 5% in 2006, which makes it below the target. The proportion of trains running on time rose above the target line again in 2008 at 97% then remain steady until the end of the period. (173 words)

Picture1.jpg
