Writing Feedback /
The figures for acid rain emissions per million tons in four different sectors in the United Kingdom [3]
acid rain in the UK
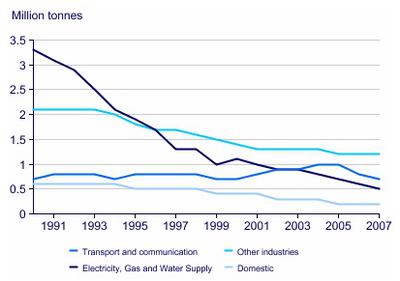
The line graph illustrates the figures for acid rain emissions per million tons in four different sectors in the United Kingdom over a period of 17 years.
Overall, It can be clearly seen that the UK experienced a considerable drop in the amount of emissions in electricity, gas, and water, domestic and other industries sectors, the opposite was true for transport and communication sector.
In 1991, the amount of emissions in electricity, gas and water was recorded at the highest level of 3.4 million among three different sectors, there were around 2 million tonnes, 0.7 million tonnes, and 0.6 million tonnes in other industries, transport and communication, and domestic sectors, respectively.
Electricity, gas, and water decreased significantly to 0.8 million tonnes in the amount of emissions rain acid in 2007, while there were a slight rose by 1 million tonnes in transport and communication sectors, acid rain emissions from domestic and other industries sector fell slowly to 0.2 million tons and 1.1 million tons, respectively.

ieltslinegraphaci.jpg

