Mrshangaung
Sep 18, 2021
Writing Feedback / The line graph illustrates the amount of people who bought music over seven years time frame [4]
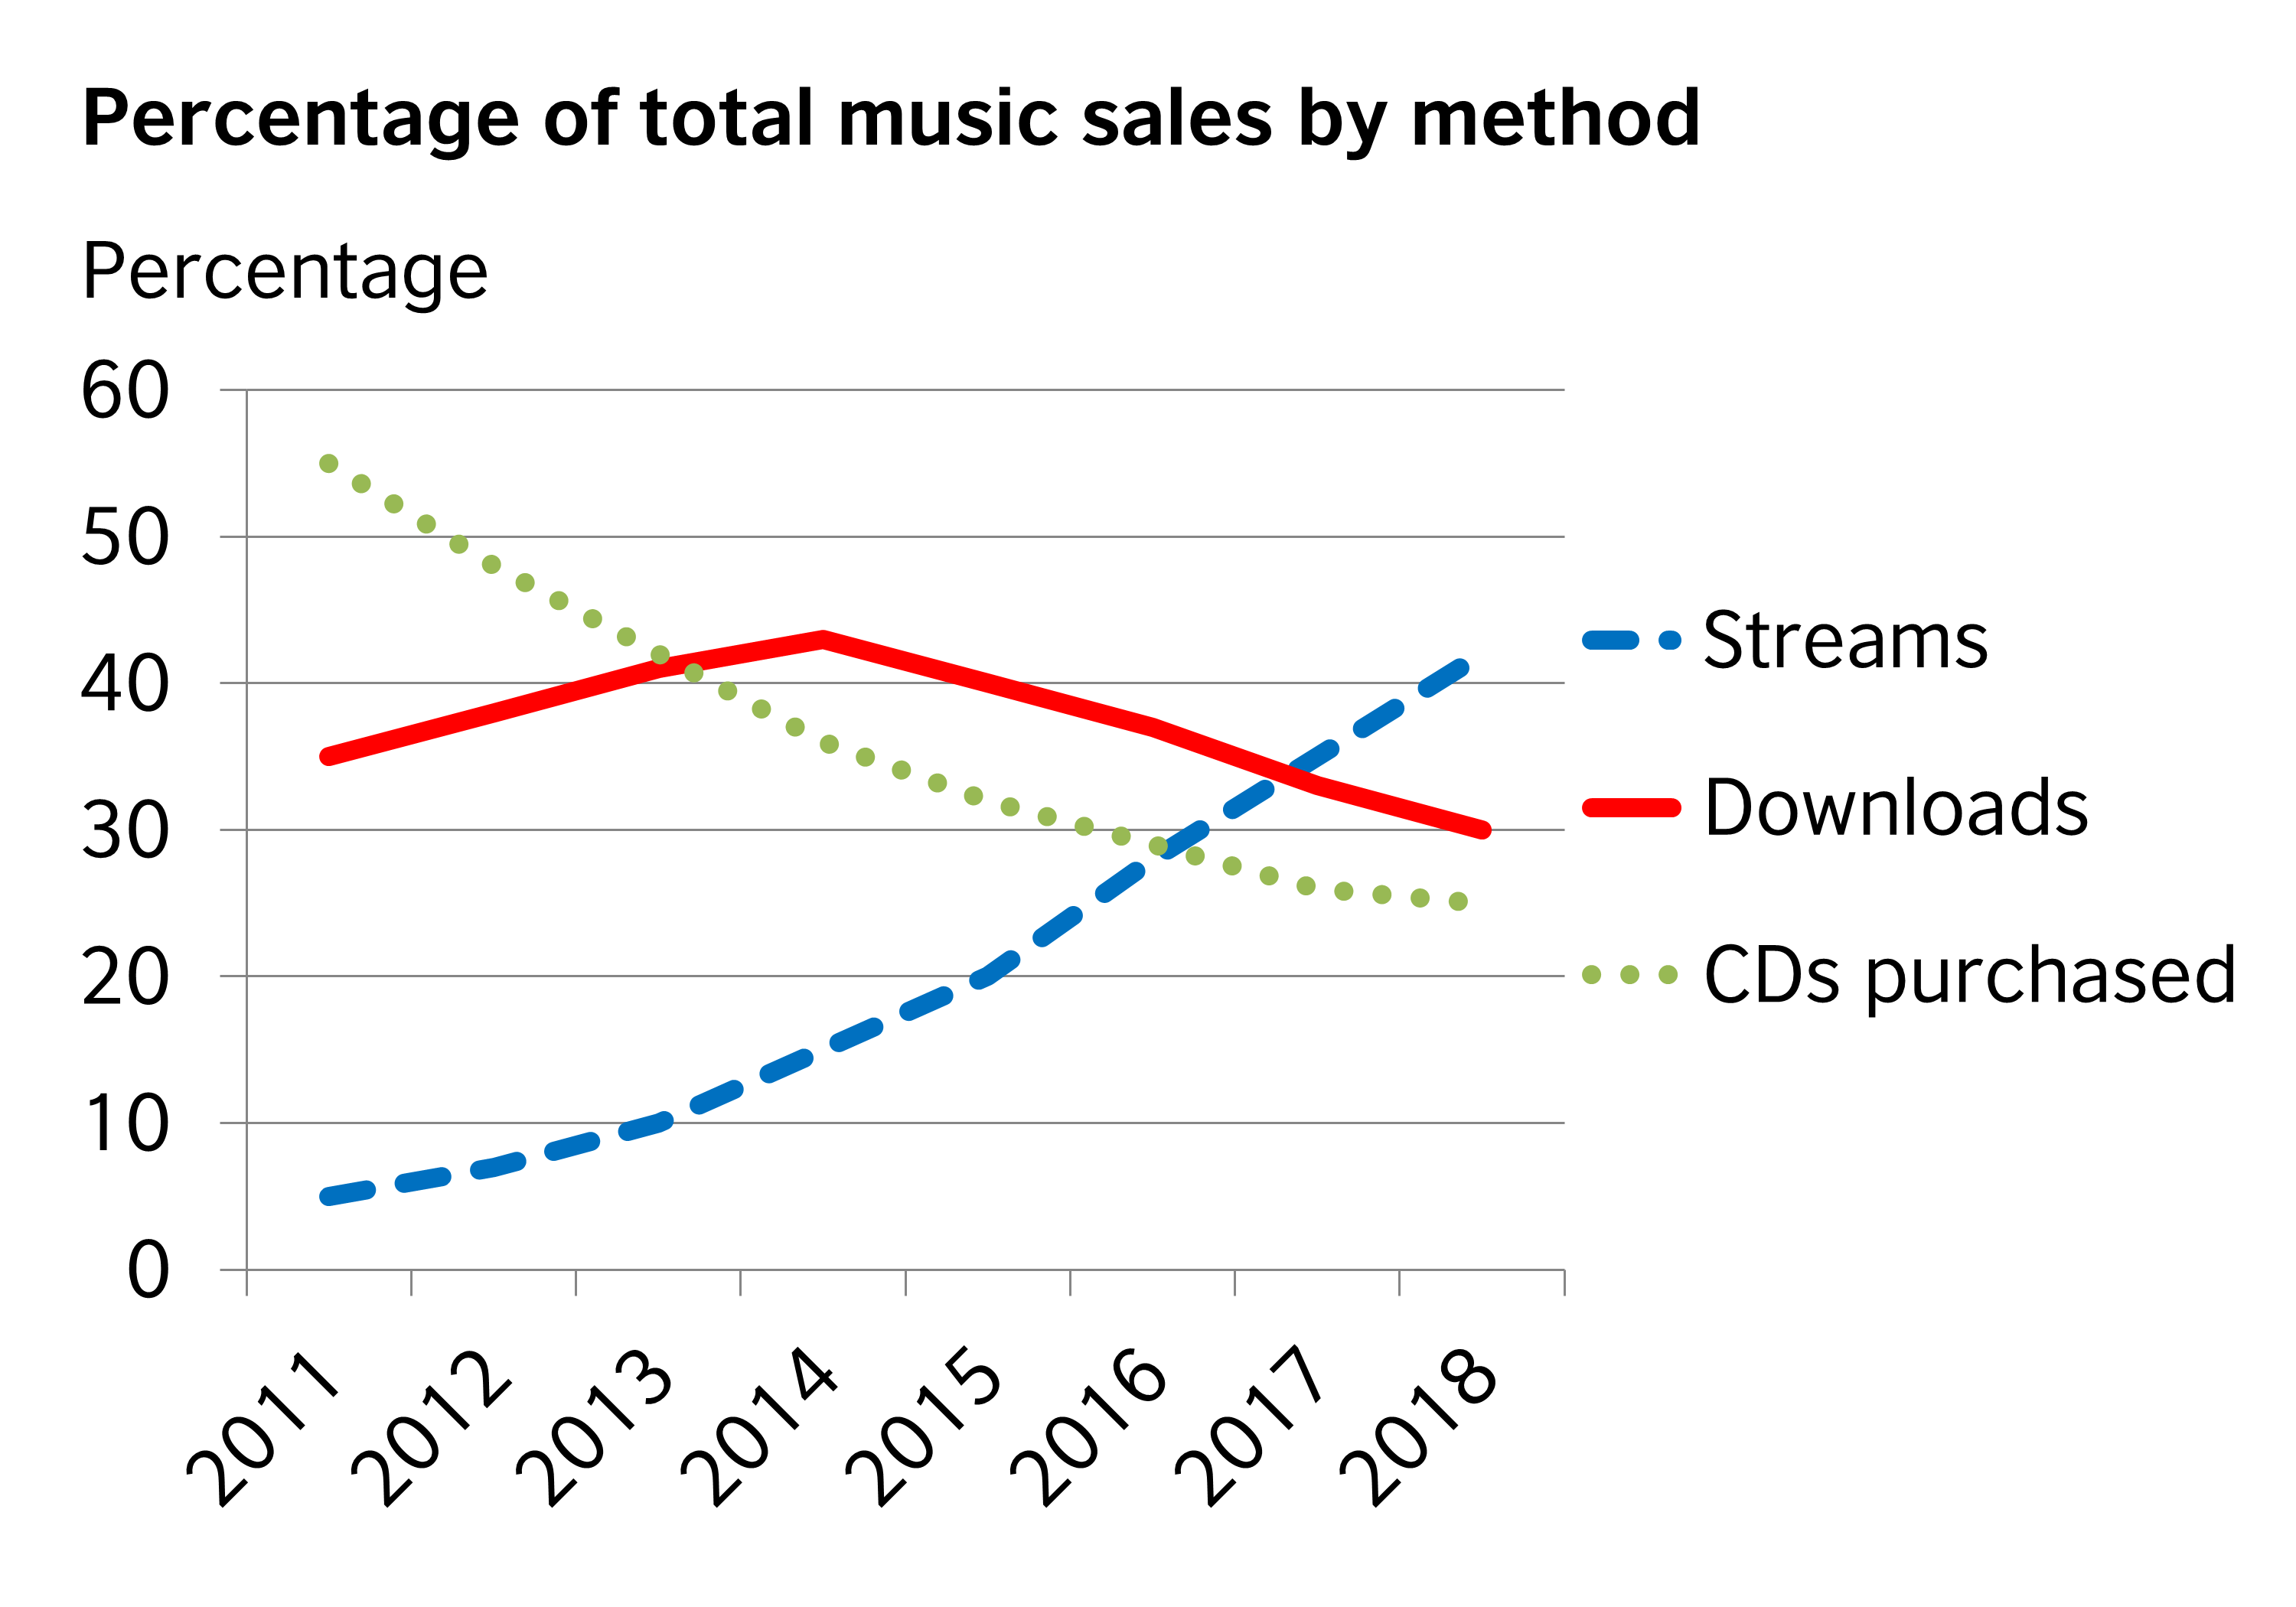
The line graph illustrates the amount of people who buy music from 2011 to 2018. Generally, music sold on streams significant rose all over the period whereas people who purchased by CDs were declining steadily. People who bought music by downloading method went up at first before decreasing until 2018.
First of all, selling music by streams stood at approximately 5 percent in 2011 followed by a steady increase which overtook the other two ways in 2016 and 2017 before reaching to just over 40 in 2018. The amount of CDs purchased began at roughly 55 then it reduced noticeably to the lowest point which is about 25 in 2018.
Secondly, the number of downloads climbed gradually in the beginning until 2014 when it reached the peak point of on average about just over 40 before jumping suddenly to 30 percent in 2018.
To conclude, streaming is the most popular way to sell music as most people buy it in streams whereas selling by CDs is the least.
The graph below shows how people buy music
The line graph illustrates the amount of people who buy music from 2011 to 2018. Generally, music sold on streams significant rose all over the period whereas people who purchased by CDs were declining steadily. People who bought music by downloading method went up at first before decreasing until 2018.
First of all, selling music by streams stood at approximately 5 percent in 2011 followed by a steady increase which overtook the other two ways in 2016 and 2017 before reaching to just over 40 in 2018. The amount of CDs purchased began at roughly 55 then it reduced noticeably to the lowest point which is about 25 in 2018.
Secondly, the number of downloads climbed gradually in the beginning until 2014 when it reached the peak point of on average about just over 40 before jumping suddenly to 30 percent in 2018.
To conclude, streaming is the most popular way to sell music as most people buy it in streams whereas selling by CDs is the least.

WritingB2Asummary.png
