Writing Feedback /
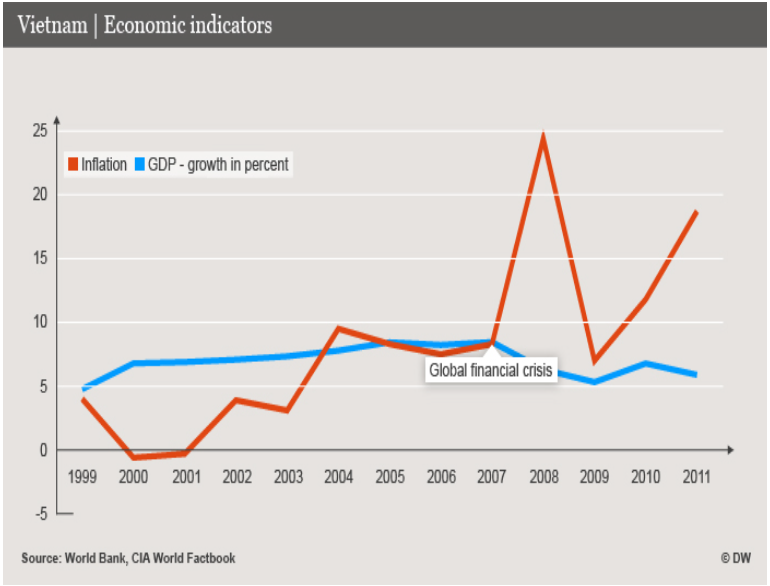
Line Graph Task-Compare the rate of inflation and GDP in VietNam between 1999 and 2011 [3]
The Graph compares the rate of inflation and GDP in VietNam over the 12-years course from 1999 to 2011.
Overall, it is clear that there was an upward trend in the rate of inflation, while the GDP did not change too much during the given period. Also, both figures met at the same record in 2005.
At the beginning of the period, the figures for both inflation and GDP were nearly equal, at around 5%. After that, the rate of inflation dropped by 5% while the GDP rose slightly to 7% in 2000. Over the next 6 years, the figure of inflation experienced a sharp increase and reach a peak of 25% in 2008. Meanwhile, there was a slight grew in the rate of GDP between 2001 and 2007 before dipping down to nearly 5%.
The rate of inflation thereafter underwent a sharp drop to 7%, then suddenly increase again to 19% in 2011. The figure of GDP, meanwhile, had fluctuations in this stage, in 2010 the percentage increased but immediately fell to 6% in 2011.

line graph

