Laelia
Sep 28, 2021
Writing Feedback / The graph below shows the percentage of people in the different age group who went to the cinema [2]
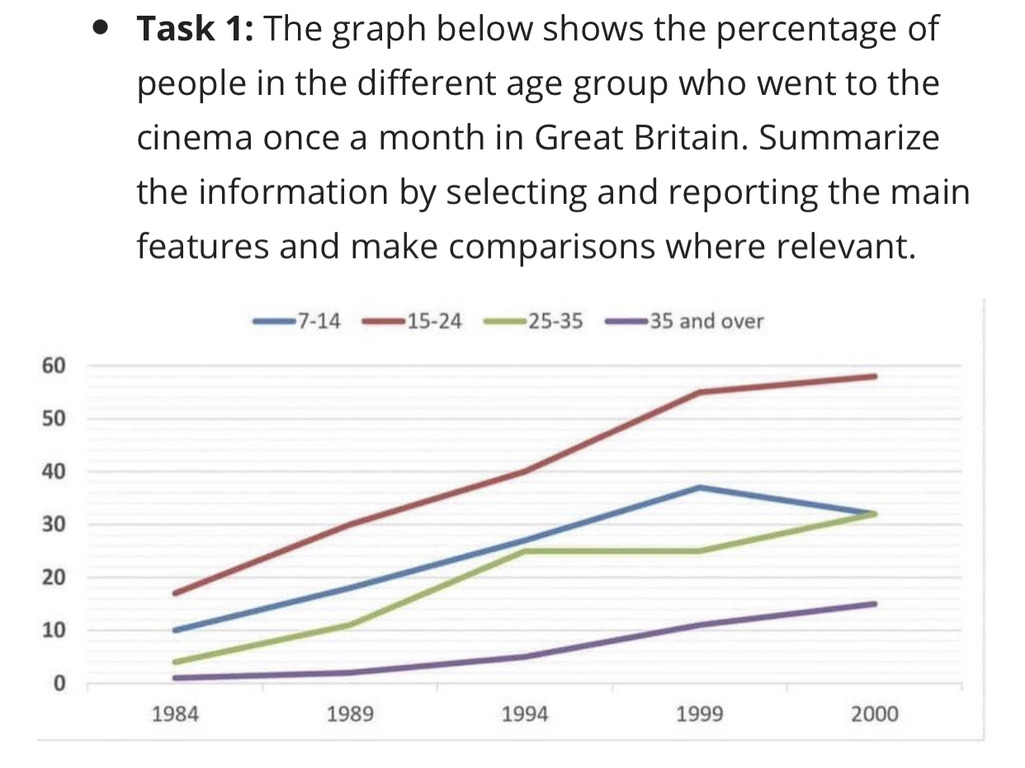
The line chart compares the share of four age groups attending cinema once a month in Great Britain from 1984 to 2000.
Overall, apart from the 7-14-year-old group, three other ones experienced a vast escalation during the 17-year period. Additionally, people whose ages range between 15 and 24 took up the highest proportion, while the opposite was true for the middle-aged group.
Commencing at about 18% in 1984, a massive growth was seen in the percentage of 15-24-year-old individuals, reaching its highest peak of approximately 60% in 2000. Likewise, the figure for people who are 35 or older rose gradually, from roughly 0% to relatively 15%.
The 1984-2000 period witnessed a slight fluctuation in the data of adults aging 25-35, starting at about 5% then soared up by approximately 20% 10 years later, followed by a mild oscillation but rose to more than 30% in the last year. In contrast, the youngest age group experienced a record of 10% in the beginning, after which it climbed to its peak of around 38% yet fell to reach the same figure as the second-oldest one.
uk data on attending cinema by age
The line chart compares the share of four age groups attending cinema once a month in Great Britain from 1984 to 2000.
Overall, apart from the 7-14-year-old group, three other ones experienced a vast escalation during the 17-year period. Additionally, people whose ages range between 15 and 24 took up the highest proportion, while the opposite was true for the middle-aged group.
Commencing at about 18% in 1984, a massive growth was seen in the percentage of 15-24-year-old individuals, reaching its highest peak of approximately 60% in 2000. Likewise, the figure for people who are 35 or older rose gradually, from roughly 0% to relatively 15%.
The 1984-2000 period witnessed a slight fluctuation in the data of adults aging 25-35, starting at about 5% then soared up by approximately 20% 10 years later, followed by a mild oscillation but rose to more than 30% in the last year. In contrast, the youngest age group experienced a record of 10% in the beginning, after which it climbed to its peak of around 38% yet fell to reach the same figure as the second-oldest one.

2E10538D76FE4C10B.jpeg
