thaonhilak
Oct 21, 2021
Writing Feedback / IELTS TASK 1 - "Line graph about recruitment of teacher" [5]
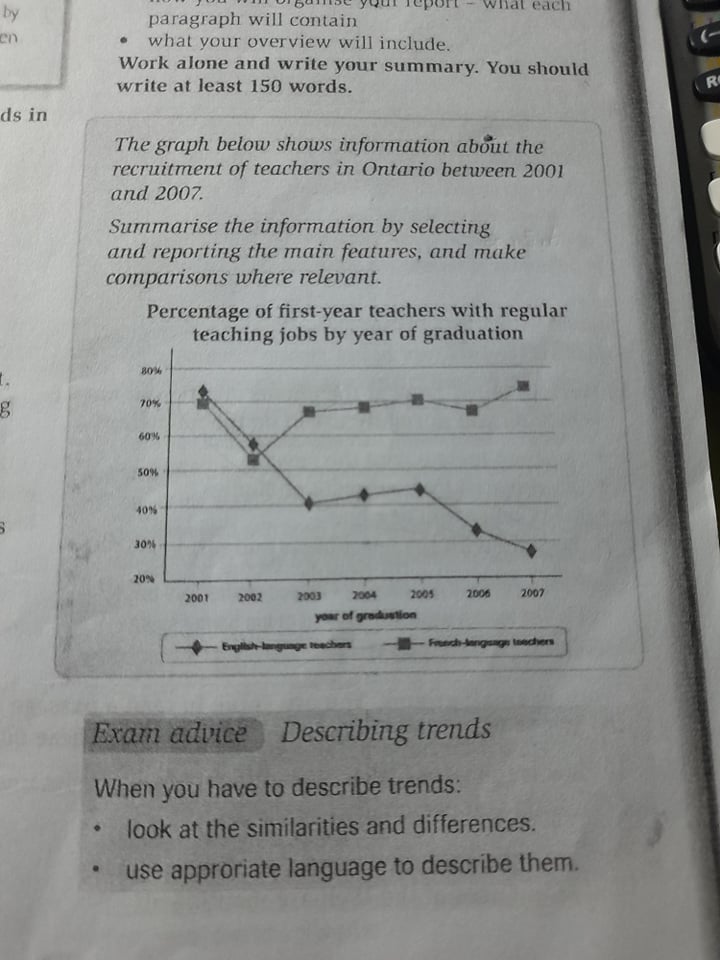
The line graph compares proportion of first-year English-language teachers and French-language teachers enrolled in Ontario between 2001 and 2007.
Overall, the percentage of English-language teachers recruited was lower and fell gradually over the period shown.
In 2001, 70% of English-language teachers had a regular job, which is the same as French-language teachers. The proportion of English-language teachers decreased significantly to 40% in 2003, while the figures for French-language teachers dipped in 2002 then returned to nearly 70% in 2003.
There was a slight climb of 5% in the proportion of teachers teaching French recruited in 2005. This figure then declined gradually and hit a low of nearly 30% in 2007.From 2003, the percentage of French-language teachers enrolled remained fairly stable at around 70%, and reached a peak at 75% in 2007.
first-year English-language teachers with regular teaching jobs
The line graph compares proportion of first-year English-language teachers and French-language teachers enrolled in Ontario between 2001 and 2007.
Overall, the percentage of English-language teachers recruited was lower and fell gradually over the period shown.
In 2001, 70% of English-language teachers had a regular job, which is the same as French-language teachers. The proportion of English-language teachers decreased significantly to 40% in 2003, while the figures for French-language teachers dipped in 2002 then returned to nearly 70% in 2003.
There was a slight climb of 5% in the proportion of teachers teaching French recruited in 2005. This figure then declined gradually and hit a low of nearly 30% in 2007.From 2003, the percentage of French-language teachers enrolled remained fairly stable at around 70%, and reached a peak at 75% in 2007.

247621321_5736918539.jpg
