daiton
Nov 25, 2021
Writing Feedback / IELTS WRITING TASK 1 - ESSAY ABOUT ECONOMICS [2]
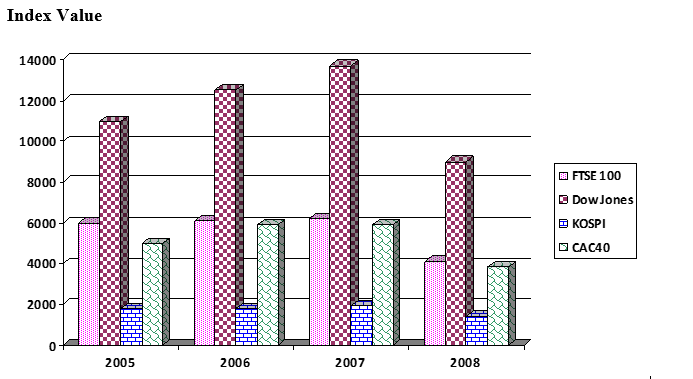
The chart shows the end of year value for four major international money market indices in 2005, 2006, 2007 and 2008. [FTSE100= UK Market Index, Dow Jones= US Market Index, KOSPI= Korean Market Index, CAC= French market Index]
Summarise the information by selecting and reporting the main features, and make comparisons where relevant.
The chart illustrates the final annual worth of four major world money market indices from 2005 to 2008. Overall, while Dow Jones, FTSE 100, KOSPI, CAC 40 escalated in the first three years, they reduced largely in the final year. We can also see that the US always took the lead, followed by the UK, France, and Korea.
From the beginning, Dow Jones rose sharply from 11000 index to more than 12000 index in just a year until reaching its peak in 2007 with nearly 14000 index. However, in 2008, the US market plummeted dramatically (down to only 9000 index), but still was at number one spot. The same thing happened with the UK : in the first three years, FTSE 100 price ascended steadily (from 5000 index to 6000 index); nevertheless, also in the last year, FTSE 100 merit decreased strikingly to approximately 3900 index.
CAC 40 went through a synonymous trend compared to the first two nations. From the start, the French Market Index remained the same value at about 6000 index in 2005, 2006, 2007. Notwithstandingly, their price dropped down almost 2000 points next year. Finally, even though Korea stayed at the last position over the period, their value dwindled the least. Indeed, in the first, second and third years, the Korean Market Index maintained its steadiness at about 2000 index, but fell down to about 1500 in the final year.
The value of four major world money market
The chart shows the end of year value for four major international money market indices in 2005, 2006, 2007 and 2008. [FTSE100= UK Market Index, Dow Jones= US Market Index, KOSPI= Korean Market Index, CAC= French market Index]
Summarise the information by selecting and reporting the main features, and make comparisons where relevant.
The chart illustrates the final annual worth of four major world money market indices from 2005 to 2008. Overall, while Dow Jones, FTSE 100, KOSPI, CAC 40 escalated in the first three years, they reduced largely in the final year. We can also see that the US always took the lead, followed by the UK, France, and Korea.
From the beginning, Dow Jones rose sharply from 11000 index to more than 12000 index in just a year until reaching its peak in 2007 with nearly 14000 index. However, in 2008, the US market plummeted dramatically (down to only 9000 index), but still was at number one spot. The same thing happened with the UK : in the first three years, FTSE 100 price ascended steadily (from 5000 index to 6000 index); nevertheless, also in the last year, FTSE 100 merit decreased strikingly to approximately 3900 index.
CAC 40 went through a synonymous trend compared to the first two nations. From the start, the French Market Index remained the same value at about 6000 index in 2005, 2006, 2007. Notwithstandingly, their price dropped down almost 2000 points next year. Finally, even though Korea stayed at the last position over the period, their value dwindled the least. Indeed, in the first, second and third years, the Korean Market Index maintained its steadiness at about 2000 index, but fell down to about 1500 in the final year.

Capture1.PNG
