Writing Feedback /
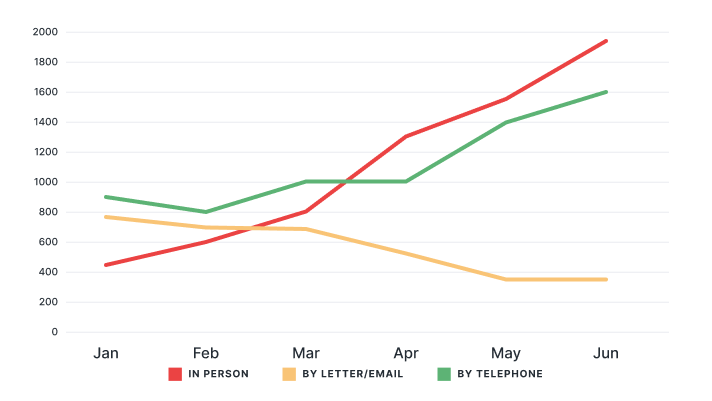
The graph below shows the number of enquiries received by the Tourist Information Office in one city [3]
Tourist Information Office in numbers
The line graphs delineates how many questions were received by the Tourist Information Office in the particular city from January to June in 2011.
Overall, there was an increase in the number of inquiries in person and by telephone received by the Tourist Information Office, while the figure for letters or mails became the less common choice. In addition, the number of queries through letters or emails was generally the lowest figure throughout the given period.
From January to March in 2011, about 950 inquiries in person were received by the Tourist Information Office in January, with subsequent decrease to reach the lowest point at exactly 800 queries in February, and a final progressive increase to 1000 enquiries in March. The figure for r dungletters or mails saw an opposite change, but to a large extent, dropping from 800 inquiries to 700 inquiries in the first three-month period. Meanwhile, the number of enquiries made in person was at just under 800 in January, followed by a significant growth from 800 to 1000 from February to March, surpassing the figure for telephone.
Regarding April to June, the number of queries in person received by the Tourist Information Office started at approximately 900 queries, after which it experienced a dramatic rise to 1400 in May, before ending the period at roughly 1600. Opposite changes can be seen in the figure for emails or letters, which decreased from 500 to 390 from April to June. Meanwhile, the number of inquiries made in person was at just under 1300 in April, followed by a significant increase from 1600 to 1800 during the last three-month period.

426ea2cf49d944fb9.png

