ahmadsalkaf
Jan 24, 2022
Writing Feedback / The graph provides information related to how many tourists visited a Carribean island [2]
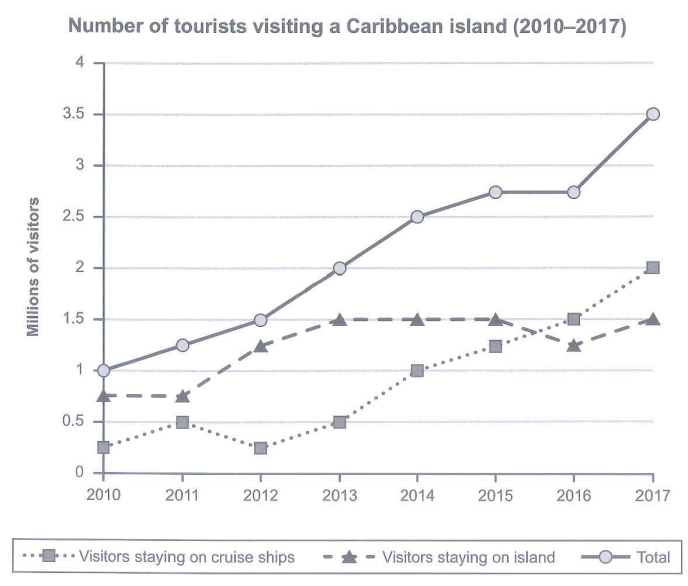
The graph provides information related to how many tourists who visited a Carribean island for a 8 year period from 2010 to 2017.
Conclusion based on the graph, visitors who staying on cruise ships, visitors who staying on the island, and the total visitors experienced a simmilar upward trend for the graph's period. Another intresting fact visitors who staying on the island indeed having an upward trend but it tend to increase steadily.
At the beginning of first 4 year, the visitors who staying on the island witnessed a fluctuation trend, and after that it continuously increased for the next 4 year. Slightly diffrent with it, the total visitors also saw a significant rise in the first 4 year, then it dramatically rose the next 4 year.
compared to the other 2 graph, in spite of increasing trend, the visitors who staying on the island trend tend to increased steadily.
Number of tourists visiting a Carribean island
The graph provides information related to how many tourists who visited a Carribean island for a 8 year period from 2010 to 2017.
Conclusion based on the graph, visitors who staying on cruise ships, visitors who staying on the island, and the total visitors experienced a simmilar upward trend for the graph's period. Another intresting fact visitors who staying on the island indeed having an upward trend but it tend to increase steadily.
At the beginning of first 4 year, the visitors who staying on the island witnessed a fluctuation trend, and after that it continuously increased for the next 4 year. Slightly diffrent with it, the total visitors also saw a significant rise in the first 4 year, then it dramatically rose the next 4 year.
compared to the other 2 graph, in spite of increasing trend, the visitors who staying on the island trend tend to increased steadily.

TASK1.png
