Writing Feedback /
The comparison of the figure of four electrical appliances and amount of time spent doing housework [2]
the changes in ownership of electrical appliances and amount of the time spent doing housework
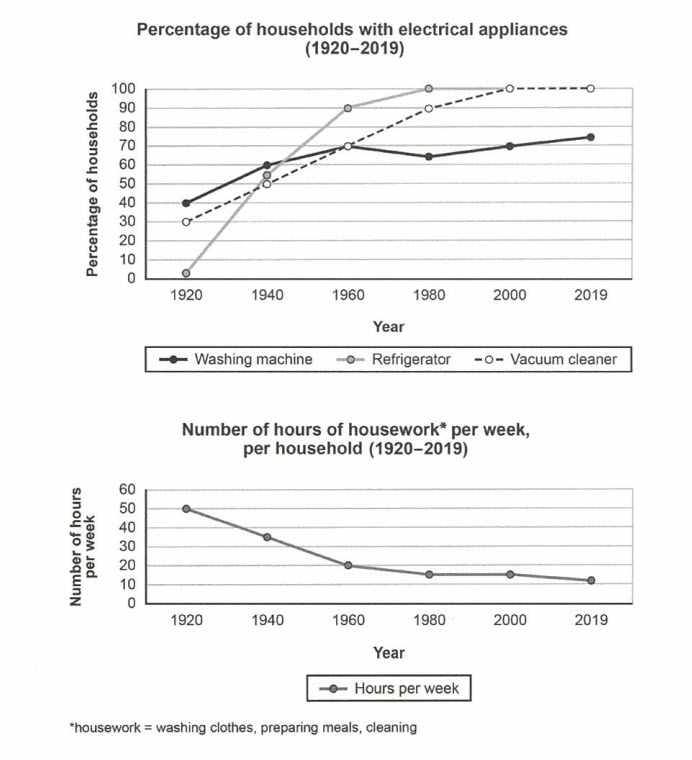
The line graphs provide the comparison of the figure of four electrical appliances in a given country and amount of time spent doing housework in households over the period of 99 years.
From an overall perspective, it is evident that the proportion of electrical appliances used has sharply increased from 1920 to 2019. However, the amount of time spent doing housework in households showed a significant decline.
In 1920, the percentage of households with electrical appliances was quite low, especially the refrigerator, at 0%. The figure for using washing machines and vaccum cleaners was higher, at percisely 40% and 30%. Meanwhile, the proportion of time that families in the country spent doing housework per week was far high which stood at 50 hours.
In the period from 1920 to 2012, the usage of refrigerator and vacuum cleaner rose dramatically to a peak of 100% and then stayed at that level. The percentage of households with washing machines started high at 40%, it also increased but reached just about 75% in 2012. By the contrast, the number of hours of housework has decreased suddenly and fell to approximately 10 hours per week in 2012.

task1test1compre.jpg

