buithanhduy
Mar 15, 2022
Writing Feedback / The chart compares and contrasts data on the changes in the number of films produced in 5 countries [2]
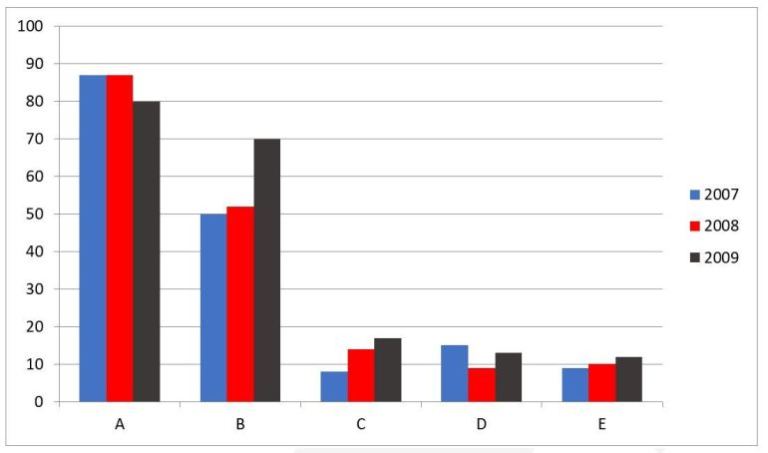
The chart compares and contrasts data on the changes in the number of films produced in five countries over a period of three years.
An overview of the diagram reveals that the number of films produced by A and D countries witnessed an upward trend over a period surveyed while the reverse was true for countries B, C and E. To specify, country A had the highest number of films produced.
In the year 2007, the number of films produced in country A was 86 films. This figure stayed stable one year later before slow decrease to nearly 80 films in 2009. In the addition, the figure for country D saw a decline slight from 15 films in 2007 to 9 films in 2008 and this figure increased marginally to 12 films in 2009.
On the other hand, the reverse was true for countries B, C and E. The year 2008, saw a rose slightly from 50 films to 52 films in 2009, after 50 films increased in the first years, climbed to about 70 films in the following three years. the period also a rise slow in the number of films produced in country C to 8 films in 2007 to 14 films in 2008. Subsequently, there was a saw dramatic growth of the films produced to 17 films. Similarly, the figure for country E grew slightly to 9 films in 2007 to 10 films in 2008 before the whose figure increased to 11 films in the end in 2009.
the number of films produced in five countries
The chart compares and contrasts data on the changes in the number of films produced in five countries over a period of three years.
An overview of the diagram reveals that the number of films produced by A and D countries witnessed an upward trend over a period surveyed while the reverse was true for countries B, C and E. To specify, country A had the highest number of films produced.
In the year 2007, the number of films produced in country A was 86 films. This figure stayed stable one year later before slow decrease to nearly 80 films in 2009. In the addition, the figure for country D saw a decline slight from 15 films in 2007 to 9 films in 2008 and this figure increased marginally to 12 films in 2009.
On the other hand, the reverse was true for countries B, C and E. The year 2008, saw a rose slightly from 50 films to 52 films in 2009, after 50 films increased in the first years, climbed to about 70 films in the following three years. the period also a rise slow in the number of films produced in country C to 8 films in 2007 to 14 films in 2008. Subsequently, there was a saw dramatic growth of the films produced to 17 films. Similarly, the figure for country E grew slightly to 9 films in 2007 to 10 films in 2008 before the whose figure increased to 11 films in the end in 2009.

IELTSWritingTask1.jpg
