Tlinh31
Mar 24, 2022
Writing Feedback / The table and pie chart give information about population in Australia according to different nation [2]
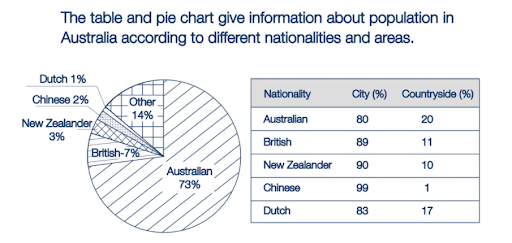
The pie chart illustrates the percentage of people from five nations living in Australia while the table describes the distribution of people in rural and urban areas based on nationalities.
In general, it can be said that the majority of Australia's population are Australian. Moreover, there are more residential areas established downtown than those in the countryside.
According to the pie chart, Australians make up approximately three-fourth of the total population, which is significantly higher than those from other four nations. Dutch is the country which has the lowest citizens living in Australia, only 1 percent is recorded on the chart.
As can be seen from the table, most Chinese people prefer to live downtown rather than in the countryside, followed by New Zealanders with 90 percent in the urban areas and 10 percent in the rural areas. On the contrary, the number of Australians living in the city takes the lowest position among five nationalities while the percentage in the countryside accounts for 20 percent, which ís the highest number of citizens compared to the four remaining nations.
different nationalities in Australia
The pie chart illustrates the percentage of people from five nations living in Australia while the table describes the distribution of people in rural and urban areas based on nationalities.
In general, it can be said that the majority of Australia's population are Australian. Moreover, there are more residential areas established downtown than those in the countryside.
According to the pie chart, Australians make up approximately three-fourth of the total population, which is significantly higher than those from other four nations. Dutch is the country which has the lowest citizens living in Australia, only 1 percent is recorded on the chart.
As can be seen from the table, most Chinese people prefer to live downtown rather than in the countryside, followed by New Zealanders with 90 percent in the urban areas and 10 percent in the rural areas. On the contrary, the number of Australians living in the city takes the lowest position among five nationalities while the percentage in the countryside accounts for 20 percent, which ís the highest number of citizens compared to the four remaining nations.

unnamed.png
