Writing Feedback /
The amount of goods transported in the United Kingdom over the course of 28 years [3]
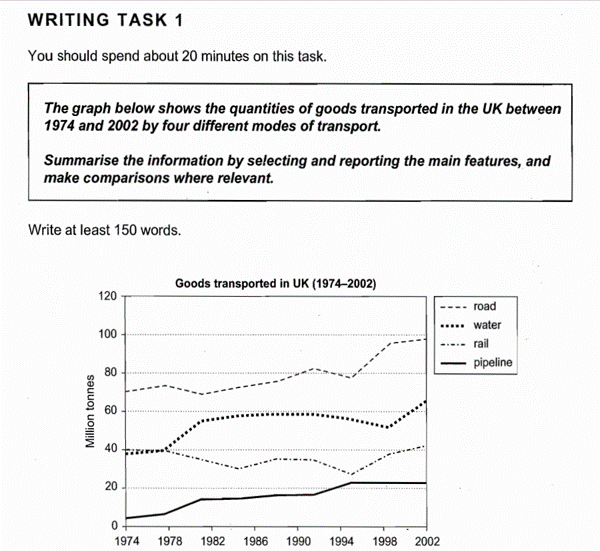
the quantities of goods transported in the UK
The line graph illustrates the amount of goods which is transported in the United Kingdom over the course of 28 years starting in 1974 via four various kinds of transport namely road, water, rail and pipeline.
Looking at the graph, it can be immediately obvious that merchandise delivered by road, water and pipeline experienced an upward trend, with the exception of rail. Another interesting point is that road is the most popular transport over the period shown.
In 1974, around 70 million tonnes of merchandise were shipped by road, in contrast to only about 5 million tonnes goods by pipeline. The figures for water and rail were the same at around 40 million.
Having fluctuated slightly , the quantities of goods transported via road reached a peak of about 100 million in 2002. The figure for goods delivered by water was 65 million compared with only 40 million of rail. Although the quantities remained the lowest among the four kinds of transport, the amount of goods loaded by pipeline witnessed a steady increase to over 20 million in the same year.

Picture1.png

