manphuongdoan
Apr 7, 2022
Writing Feedback / The line graph illustrates the amount of meat and poultry that US residents consumed [2]
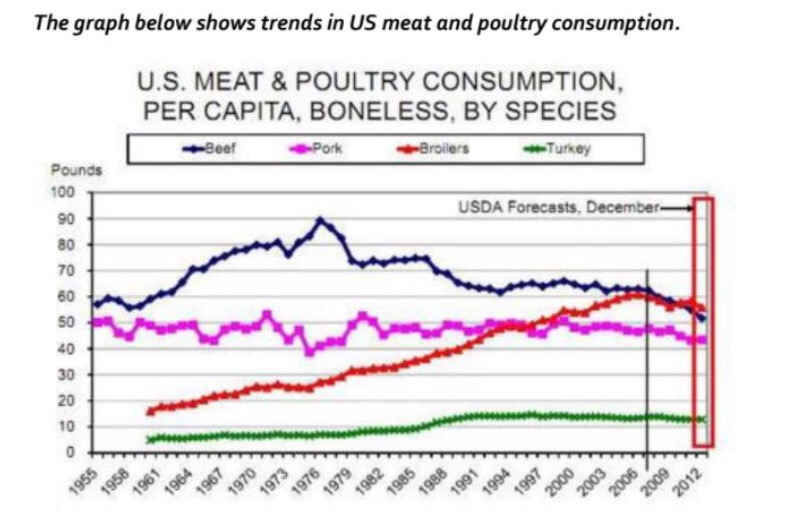
The line graph illustrates the amount of meat and poultry that US residents consumed.
Overall, the amount of beef consumption was the highest, while the figure for turkey was the lowest. And the amount of broilers used experienced the fastest increase over the period shown.
In 1995, the consumption of beef was the highest, at about 67 pounds and this figure for pork was lower, at 50 pounds. In 1961, the amount of the ingestion of broilers and turkey were at a low level, at just 15 pounds and 5 pounds respectively.
From 1995 to 1976, the amount of beef consumption rose and reached its peak at around 90 pounds, before falling to 50 pounds in 2012. In contrast, the amount of pork ingestion fluctuated and reached the lowest rate in 1976, at 40 pounds. This figure stayed at this rate in the rest of the period. Between 1976 and 2012, broilers consumption increased significantly and peaked at 60 pounds. At the same time, the figure for turkey just remained at the same level.
trends in US meat and poultry consumption
The line graph illustrates the amount of meat and poultry that US residents consumed.
Overall, the amount of beef consumption was the highest, while the figure for turkey was the lowest. And the amount of broilers used experienced the fastest increase over the period shown.
In 1995, the consumption of beef was the highest, at about 67 pounds and this figure for pork was lower, at 50 pounds. In 1961, the amount of the ingestion of broilers and turkey were at a low level, at just 15 pounds and 5 pounds respectively.
From 1995 to 1976, the amount of beef consumption rose and reached its peak at around 90 pounds, before falling to 50 pounds in 2012. In contrast, the amount of pork ingestion fluctuated and reached the lowest rate in 1976, at 40 pounds. This figure stayed at this rate in the rest of the period. Between 1976 and 2012, broilers consumption increased significantly and peaked at 60 pounds. At the same time, the figure for turkey just remained at the same level.

AC6CD746C6B34E70A.jpeg
