hyemimibun2612
Aug 18, 2022
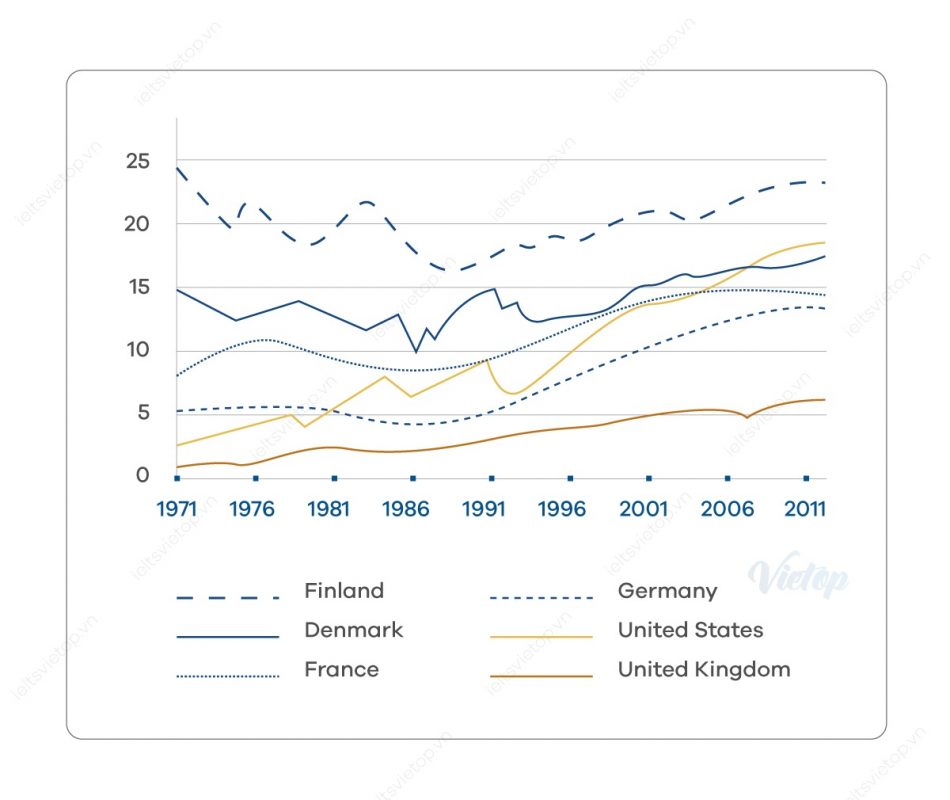
Writing Feedback / The picture below shows the use of renewable energy accounting the total energy from 1971 to 2006. [2]
Presented for consideration is a line graph illustrating the usage of total sustainable energy in 6 countries between 1971 and 2006.
From an overall perspective, there was an increase in the use of renewable energy in almost all countries except for Finland, with the US witnessing the most dramatic rise. Despite this, the UK consistently had the lowest use throughout the period.
Looking at the graph in more detail, the usage of sustainable energy in Denmark commenced the period at 15%, after which it saw a slight rise to about 17, 5% in 2011. Similar change, but to lesser extents, which grew from 8% to almost 15% and from only 1% to around 6% respectively.
The usage in energy which could be inexhaustible had a significant jump to exceed France and Denmark prior to reaching a peak at nearly 18% at the end of the period. Meanwhile, Finland had experienced a downward tendency until it went up again in 1991 and consistently was the highest use of all countries.
renewable energy usage numbers
Presented for consideration is a line graph illustrating the usage of total sustainable energy in 6 countries between 1971 and 2006.
From an overall perspective, there was an increase in the use of renewable energy in almost all countries except for Finland, with the US witnessing the most dramatic rise. Despite this, the UK consistently had the lowest use throughout the period.
Looking at the graph in more detail, the usage of sustainable energy in Denmark commenced the period at 15%, after which it saw a slight rise to about 17, 5% in 2011. Similar change, but to lesser extents, which grew from 8% to almost 15% and from only 1% to around 6% respectively.
The usage in energy which could be inexhaustible had a significant jump to exceed France and Denmark prior to reaching a peak at nearly 18% at the end of the period. Meanwhile, Finland had experienced a downward tendency until it went up again in 1991 and consistently was the highest use of all countries.

dethiieltswriting.jpg
