nanhh123
Sep 12, 2022
Writing Feedback / Females participating in parliament - IELTS WRITING TASK 1 [4]
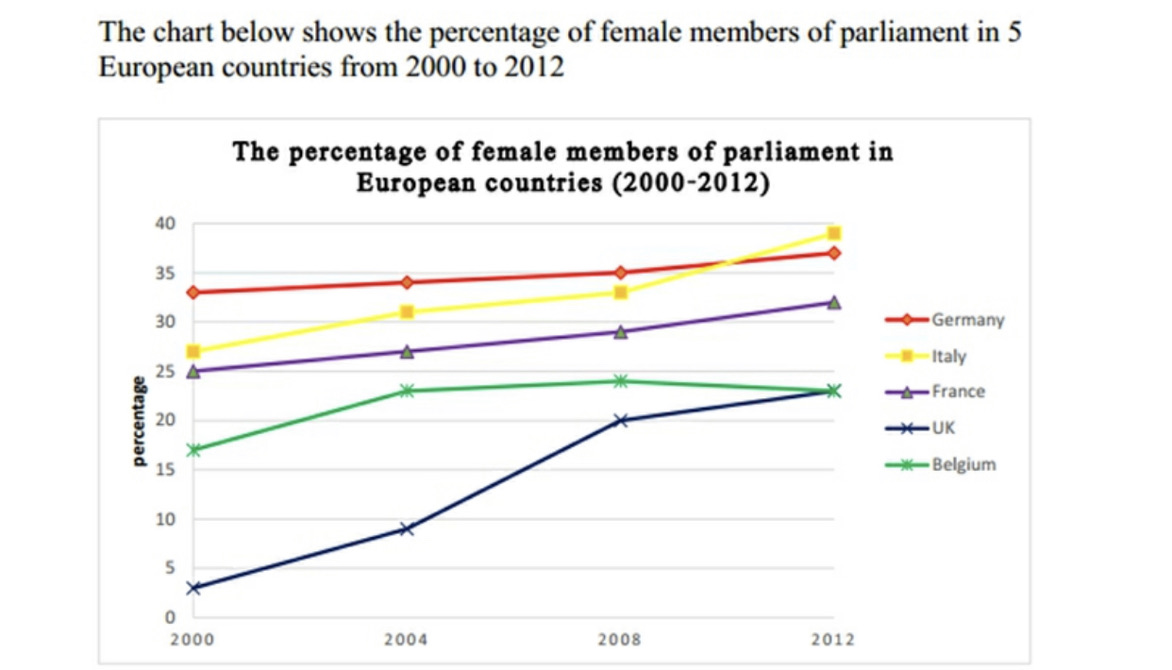
The supplied chart demonstrates the percentage of females participating in parliament in 5 European countries over a span of 12 years commencing from 2000.
Overall, it is clear that the proportion of female members of parliament in 5 targeted countries experienced an upward trend, with the figure in Germany almost remained the highest during the timescale.
Looking at the supplied chart more closely, it can be observed from 25 percent in 2000, the proportion of the number of women in France's parliament above 35 underwent a gradual growth to approximately 7 percent at the end of timescale. Similarly, the number of female members of Germany's parliament experienced a slight increase from above 35 percent to about 35 percent in 2012. During the same period, an upward trend can be seen in the figure for female members of Italy's parliament from nearly 26 percent to above 40 percent throughout the surveyed period. In addition, 2010 marked the year when the number of female members of Italy's parliament became equal to that of Germany's parliament with the figure for about 36 percent.
From a low of merely 5 percent in 2000, there was a near fivefold increase in the percentage of female members in UK's parliament with the figure for about 25 percent at the end of period. From 2004 to 2008, there were more and more English women participating in parliament from 9 percent to about 20 percent, while the data on Belgium growed slowly. A slightly downward trend can be seen in the figure of Belgium. The year 2012 marked the point at which the number of female members of UK's parliament overtook that of Belgium's parliament.
Females participating in parliament
The supplied chart demonstrates the percentage of females participating in parliament in 5 European countries over a span of 12 years commencing from 2000.
Overall, it is clear that the proportion of female members of parliament in 5 targeted countries experienced an upward trend, with the figure in Germany almost remained the highest during the timescale.
Looking at the supplied chart more closely, it can be observed from 25 percent in 2000, the proportion of the number of women in France's parliament above 35 underwent a gradual growth to approximately 7 percent at the end of timescale. Similarly, the number of female members of Germany's parliament experienced a slight increase from above 35 percent to about 35 percent in 2012. During the same period, an upward trend can be seen in the figure for female members of Italy's parliament from nearly 26 percent to above 40 percent throughout the surveyed period. In addition, 2010 marked the year when the number of female members of Italy's parliament became equal to that of Germany's parliament with the figure for about 36 percent.
From a low of merely 5 percent in 2000, there was a near fivefold increase in the percentage of female members in UK's parliament with the figure for about 25 percent at the end of period. From 2004 to 2008, there were more and more English women participating in parliament from 9 percent to about 20 percent, while the data on Belgium growed slowly. A slightly downward trend can be seen in the figure of Belgium. The year 2012 marked the point at which the number of female members of UK's parliament overtook that of Belgium's parliament.

Line Graph
