Tommy Jasper
Feb 9, 2023
Writing Feedback / Ielts Writing Task 1: The supplied line graph indicates the consumption of beef, lamb and fish [2]
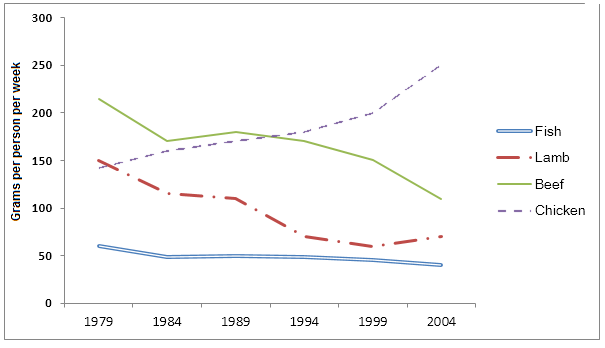
The supplied line graph indicates the consumption of fish and some different kinds of meat, namely beef, lamb and fish of a nation which is located in Europe from 1979 to 2004.
Overall, whereas the consumption of beef, lamb and meat decreased, that of chicken went up. Besides, it can be clarified that fish was consumed the least, but the consumption of chicken taken the lead.
The amount of chicken was consumed started at 140 grams each week at the beginning of 1979. Afterwards, there was a rise of 180 grams during 1989. Moreover, the year of 1994 witnessed a sharp upward trend in how much chicken was eaten, approximately 225 grams on a weekly basis. Over a period of 10 years from 1994 to 2004, that of chicken continued to rise to 250 gram.
In terms of the consumption of beef, it fell slightly from 220 grams (1989). Besides, there was a similar trend in two categories left, namely lamb and fish. Both of them went down from 150 grams in 1979 to 120 grams weekly in 1989 with lamb and from 60 grams during 1979 to about 47 grams in 1989 with fish. After that, the amount of fish consumed stayed remain over a period of ten years between 1994 and 2004. Yet, that of beef and lamb plunged continuously at about 180 grams to 125 grams and 70 grams to 60 grams, respectively.
the consumption of fish and some different kinds of meat
The supplied line graph indicates the consumption of fish and some different kinds of meat, namely beef, lamb and fish of a nation which is located in Europe from 1979 to 2004.
Overall, whereas the consumption of beef, lamb and meat decreased, that of chicken went up. Besides, it can be clarified that fish was consumed the least, but the consumption of chicken taken the lead.
The amount of chicken was consumed started at 140 grams each week at the beginning of 1979. Afterwards, there was a rise of 180 grams during 1989. Moreover, the year of 1994 witnessed a sharp upward trend in how much chicken was eaten, approximately 225 grams on a weekly basis. Over a period of 10 years from 1994 to 2004, that of chicken continued to rise to 250 gram.
In terms of the consumption of beef, it fell slightly from 220 grams (1989). Besides, there was a similar trend in two categories left, namely lamb and fish. Both of them went down from 150 grams in 1979 to 120 grams weekly in 1989 with lamb and from 60 grams during 1979 to about 47 grams in 1989 with fish. After that, the amount of fish consumed stayed remain over a period of ten years between 1994 and 2004. Yet, that of beef and lamb plunged continuously at about 180 grams to 125 grams and 70 grams to 60 grams, respectively.

consumptionfishmea.png
