Writing Feedback /
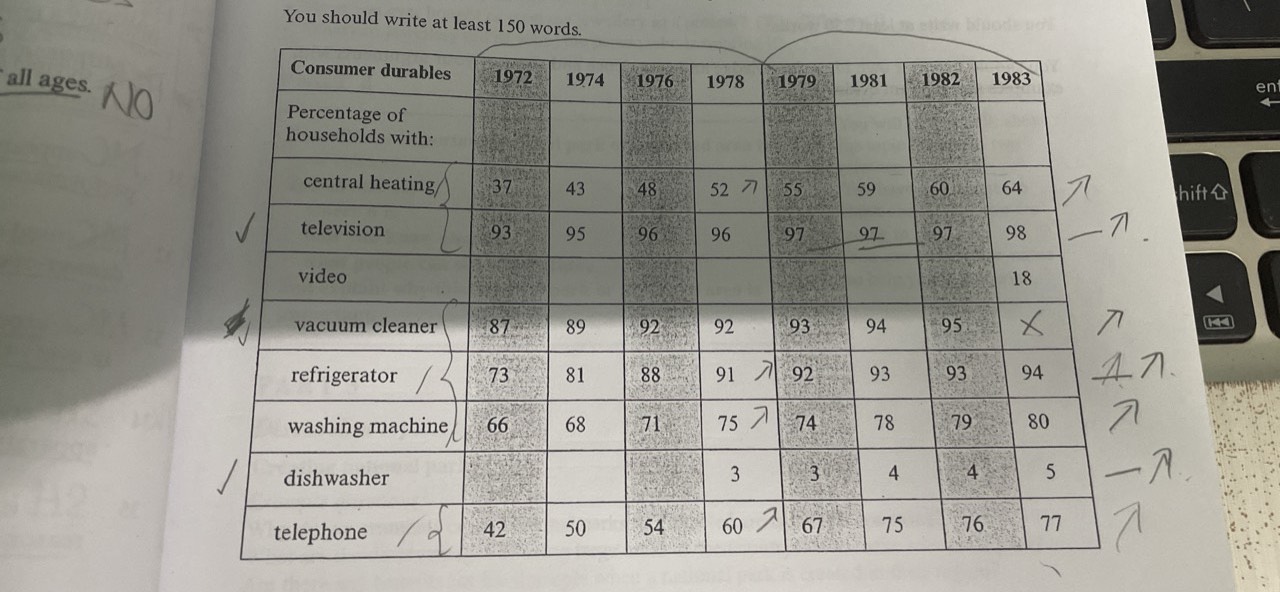
IELTS 1: The table below shows different home appliances owned in Great Britain from 1972 to 1983. [3]
The given table demonstrates the proportion of durablles (telephone, refrigerator, etc) which were owned by consumers in UK in 8 years from 1972 to 1983.
Overall, it is clear that the highest percentages of households owned each year went on television, vacuum cleaner, refrigerator. On the other hand, the dishwasher has the lowest percentages in the table.
In the first four years, the figures of television and vacuum cleaner were the largest and experienced an upwards trend as 96% and 92% respectively. Moreover, the central heating, refrigerator, washing machine and telephone were matched by a roughly similar trend. The dishwasher was different with only 3% in 1978.
From 1979 to 1983, the proportion ò central heating, washing machine and telephone continuous increased to 64%, 80% and 77% respectively. However, the figures of television, refrigerator and dishwaher bucked the trend with leveling off in 2 years 1981 and 1982, then they went on experiencing a small rebound in 1983. The percentages of video just appeared only 18% in the last year.

z4142597211450_82550.jpg

