Writing Feedback /
A glance at graph provided reveals the individual carbon dioxide emissions in 4 European countries [4]
co2 emmisions graph analysis
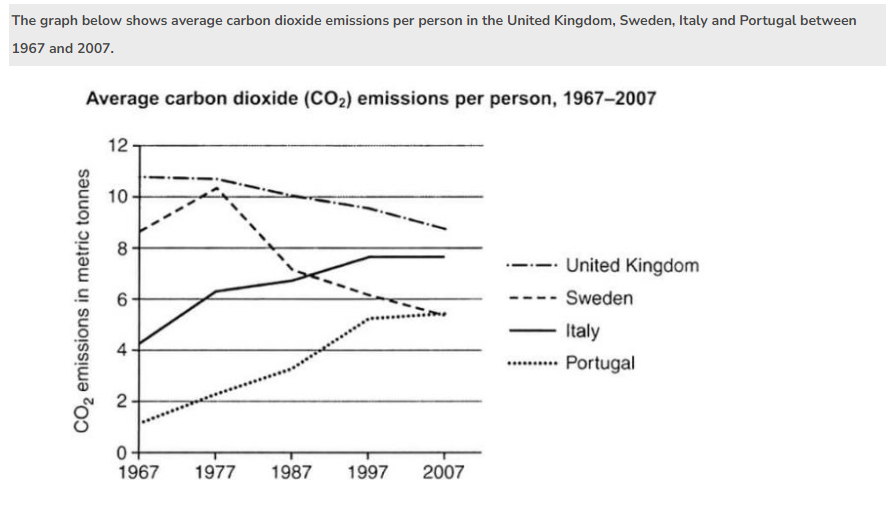
A glance at graph provided reveals the individual carbon dioxide emissions in 4 European countries: UK, Sweden, Italy and Portugal between 1967 and 2007.
In general, what stands out from the feature is that Portuguese and Italian emitted carbon dioxide less than Swedish and British in 1967. However, the trend changed from 1977 until 2007.
In 1967, the carbon dioxide emission was under 2 metric tonnes in Portugal and was slightly above 4 metric tonnes in Italy. The following years, both countries rose steadily by 4 metric tonnes, in which, grew from approximate 2 metric tonnes to under 6 metric tonnes in Portugal and from around 4 metric tonnes to approximate 8 metric tonnes in Italy.
Meanwhile, reaching a peak of somewhere in the vicinity of 11 metric tonnes in 1967, United Kingdom's citizen made a downward trend in carbon emission over period of time and finally reached the bottom at just under 9 metric tonnes in 2007. Also, Sweden's carbon dioxide emission was at under 9 metric tonnes in 1967. There was a noticeable growth to approximate 11 metric tonnes in 1977, before falling to a low at under 6 metric tonnes in 2007.

Screenshot2023051.png

