Writing Feedback /
Writing IELTS task1: how elderly people in the United States spent their free time [4]
The graph below shows how elderly people in the United States spent their free time between 1980 and 2010.Summarise the information by selecting and reporting the main features, and make comparisons where relevant.
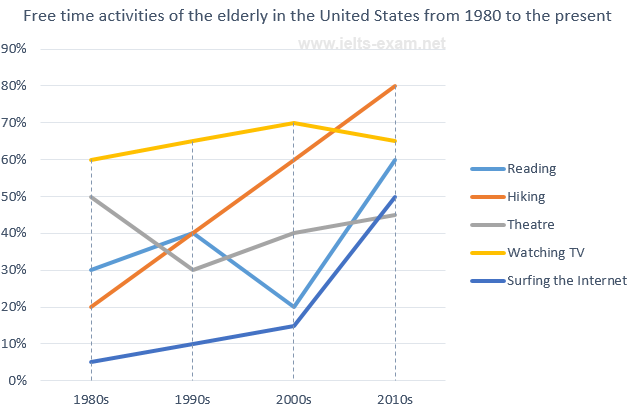
The line graph given compares the US elderly citizens in terms of their unwinding activies divided into 5 sectors from 1980 to 2010
Overall, while the numbers of internet users and hikers saw the noticeable increase throughout the surveyed period, the rest experienced erratic behaviors with varied trends. What stands out from the chart is the dominance of watching TV in the beginning of the period, which was surpassed by hiking in 2010.
Specifically, watching TV was the most preferable choice for the elder to spend their spare time in 1980, with 60% of the total, follwed by 50% and 30% respectively of who attended theatre and read book at the same time. Subsequently, while the percentage of TV watcher topped out at 70% in 2000 before a dip from that time onwards, the figures for old theatre attendees and reader recorded a fluctuation around 20% to 60%
Turning to the other figures, commencing with under 10% of the elderly surfing the Internet at their free time in 1980, that rate saw a marginal rise to about 15% prior to a over threefold jump at 50% in 2010. The period of 30 years between 1980 and 2010 revealed a continual growth in hiking group from 20% to 80%, which was the highest at the end of the period.

wr2.png

