sonbiee
Sep 18, 2023
Writing Feedback / IELTS WRTING TASK 1 - TABLE: INTERNATIONAL STUDENTS IN CANADA AND USA [NEW]
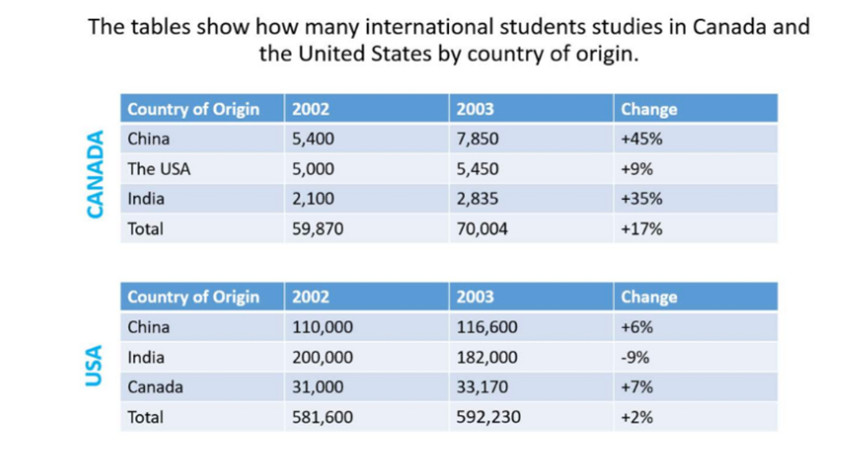
The table delineates the number of foreign students in Canada and the USA by each original country. Overall, the number of foreign students always increased each year and the same order was valid for the percentage changes, except for Indian students in the USA.
Chinese students were recorded to have the most significant percentage in student changes with 15% (about 70000 students) but still insignificant compared to the US with roughly 600000 students. Turning to the USA, the figures for Chinese students increased slightly to 116000 students in 2003. While compared to Canada, the statistics recorded the most enormous gap with 45% Chinese student changes.
In terms of Indian students, although their data always remain the most prevalent compared to other figures, the proportion of Indian students changes was the unique metrics decreased. In Canada, the reverse was true for the Indian students when they saw the second largest increase in figures with 35%. Bounce to the American and Canadian students, the figures for American students were the highest. However, their statistics were seen as the only figures that decreased by 9% while the reverse was true for Canadian students when they had the least considerable and they are the second-largest.
students in canada by their country of origin
The table delineates the number of foreign students in Canada and the USA by each original country. Overall, the number of foreign students always increased each year and the same order was valid for the percentage changes, except for Indian students in the USA.
Chinese students were recorded to have the most significant percentage in student changes with 15% (about 70000 students) but still insignificant compared to the US with roughly 600000 students. Turning to the USA, the figures for Chinese students increased slightly to 116000 students in 2003. While compared to Canada, the statistics recorded the most enormous gap with 45% Chinese student changes.
In terms of Indian students, although their data always remain the most prevalent compared to other figures, the proportion of Indian students changes was the unique metrics decreased. In Canada, the reverse was true for the Indian students when they saw the second largest increase in figures with 35%. Bounce to the American and Canadian students, the figures for American students were the highest. However, their statistics were seen as the only figures that decreased by 9% while the reverse was true for Canadian students when they had the least considerable and they are the second-largest.

z4678505112634_24a90.jpg
