krystal2023
Oct 23, 2023
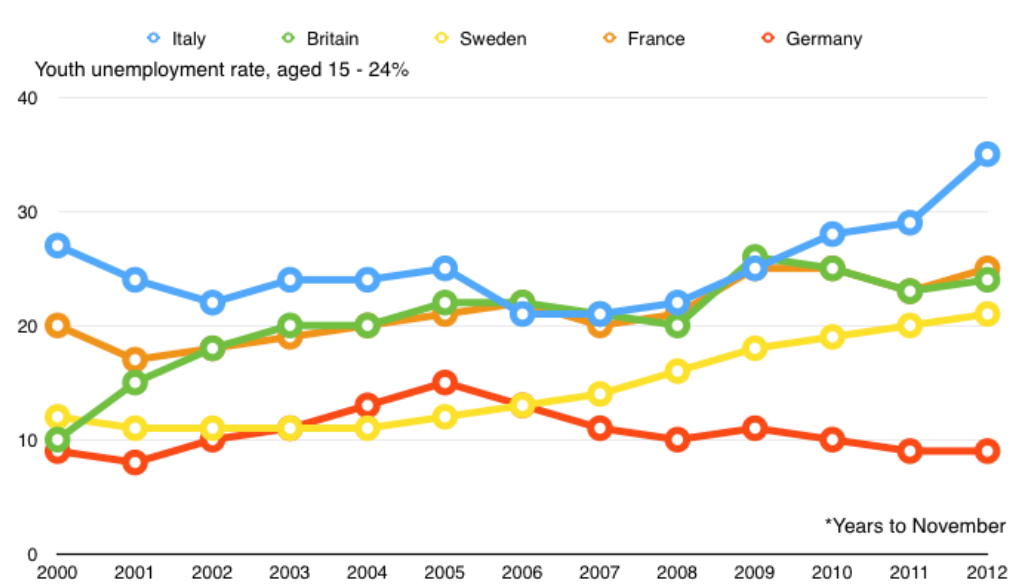
Writing Feedback / The line graph below shows changes in the youth unemployment rate from 2000 to 2012. [2]
The line chart gives information about the percentage of young people without a job in five European countries between 2000 and 2012.
Overall, there was an increase in the proportion of young unemployed people in four countries including Italy, Britain, Sweden, and France for the whole period, while Germany remained stable. In addition, Italy generally had the highest rate over the period shown.
In 2000, the youth unemployment rate in Italy was about 27%, while the figure for France was 20%, double that of Britain. One year later, both Italy and France saw a decline to 34% and 17% respectively, whereas Britain witnessed a rise of 5%. From 2006 to 2008, these figures in all three countries leveled off between 20% and 22%, before ending the period at about 35%, 25%, and 24% respectively.
12% of young people in Sweden could not find jobs in 2000, with a leveling off at 11% in the next four consecutive years, and until 2004 starting to increase continuously to 21% at the end of the period. The German unemployed accounted for just under 10% of the total young labor force, and the figure reached a peak at around 15% after five years, followed by a gradual decrease to its first value in 2012.
youth unemployment rate in five european countries
The line chart gives information about the percentage of young people without a job in five European countries between 2000 and 2012.
Overall, there was an increase in the proportion of young unemployed people in four countries including Italy, Britain, Sweden, and France for the whole period, while Germany remained stable. In addition, Italy generally had the highest rate over the period shown.
In 2000, the youth unemployment rate in Italy was about 27%, while the figure for France was 20%, double that of Britain. One year later, both Italy and France saw a decline to 34% and 17% respectively, whereas Britain witnessed a rise of 5%. From 2006 to 2008, these figures in all three countries leveled off between 20% and 22%, before ending the period at about 35%, 25%, and 24% respectively.
12% of young people in Sweden could not find jobs in 2000, with a leveling off at 11% in the next four consecutive years, and until 2004 starting to increase continuously to 21% at the end of the period. The German unemployed accounted for just under 10% of the total young labor force, and the figure reached a peak at around 15% after five years, followed by a gradual decrease to its first value in 2012.

Untitled.png
