lanhoangngoc
Oct 24, 2023
Writing Feedback / The graph below shows the consumption of fish and three kinds of meat from 1979 to 2004 [2]
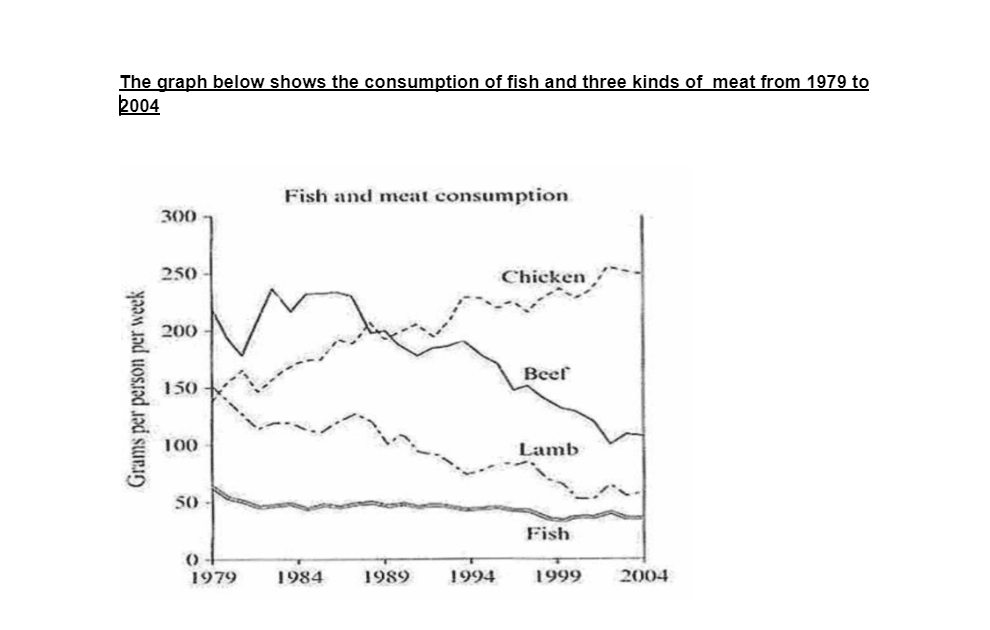
The graph below shows the consumption of fish and three kinds of meat from 1979 to 2004.
The chart compares the fish consumption with three kinds of meat consumed from 19179 to 2004. Overall, the consumption of these kinds of meat showed a downward trend except for chicken. It is also noticeable that the fish consumption was the lowest over the given years.
At the beginning of the period, beef was head and shoulders with above 200 grams consumed weekly, followed by lamb and chicken, at around 150 and 140 grams respectively. Over the following ten years, beef and lamb consumption fluctuated widely while the figure for fish eaten went through a period of wild fluctuation at around 50 grams. By contrast, it witnessed a significant rise in chicken consumption and the year 1989 marks the point it surpassed the figure for beef.
From that time on, the chicken eaten continued to increase sharply before reaching a peak of 250 grams per capita. The consumption of land and fish saw a slight decrease at around 50 grams whereas there was a significant decrease in the figure for beef at the end of the period.
fish, meat consumption graph analysis
The graph below shows the consumption of fish and three kinds of meat from 1979 to 2004.
The chart compares the fish consumption with three kinds of meat consumed from 19179 to 2004. Overall, the consumption of these kinds of meat showed a downward trend except for chicken. It is also noticeable that the fish consumption was the lowest over the given years.
At the beginning of the period, beef was head and shoulders with above 200 grams consumed weekly, followed by lamb and chicken, at around 150 and 140 grams respectively. Over the following ten years, beef and lamb consumption fluctuated widely while the figure for fish eaten went through a period of wild fluctuation at around 50 grams. By contrast, it witnessed a significant rise in chicken consumption and the year 1989 marks the point it surpassed the figure for beef.
From that time on, the chicken eaten continued to increase sharply before reaching a peak of 250 grams per capita. The consumption of land and fish saw a slight decrease at around 50 grams whereas there was a significant decrease in the figure for beef at the end of the period.

consumption
