vananh1009
Jun 2, 2024
Writing Feedback / WRITING PART 1 - PARTICIPATING IN REGULAR ACTIVITIES [2]
Hi, could you guys give some comments on this? Thank you!!
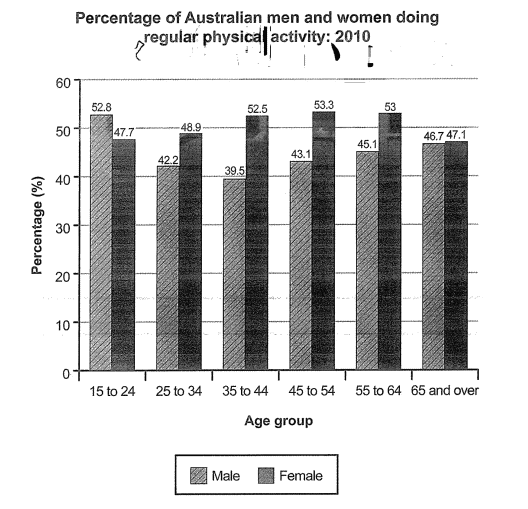
The chart illustrates how the proportion of Australian men and women engaging in regular exercise in 2010 varied across six different age groups. Overall, female participation rates were higher than males in most age groups. While regular physical activities attracted women in middle age the most, male participation rates began highest in the age group of 15-24 and saw a decline in their figures in middle age.
Regarding the age range from 15 to 44, male engagements in physical activities followed a downward trend, while their female counterparts had an opposite pattern. Among teenagers and young adults aged 15-24, males had a high participation rate with 52.8% compared to only 47.7% of females, which was also males' highest rate across all age groups. However, male figures were not maintained and dropped significantly in the 25-34 and 35-44 age groups, where male rates ranged from around 40-42% while female participation slightly rose to about 49-53% within the age range of 25-34.
In the 45+ age group, female participation rates experienced a slight decrease while men showed more interest in exercise. 53.3% of women did frequent physical activities and reached their peak in the 45-54 age group, approximately 10% higher than males. Nevertheless, from the age of 55 onwards, female rates saw a significant decline while males decreased their participation levels to a similar rate in the 65 or older age group, at roughly 47%.

dethiwritingtask.png

