akifielts
Oct 7, 2014
Writing Feedback / IELTS Task 1 Graphs: UK tourism statistics [5]
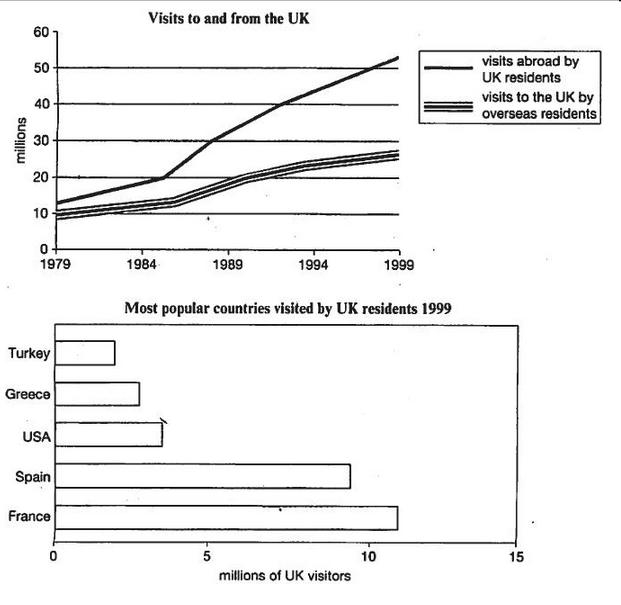
The charts below give information about travel and from the UK, and about the most popular countries for UK residents to visit. Summarise the information by selecting and reporting the main features, and makes comparisons where relevant.
The line graph compares the number of visits to the UK and visits of British people to other countries over a period of 20 years. The bar graph illustrates the six most preferred countries to visit by British people in 1999.
Overall, it's clear that there was a significant increase in the number of visits abroad and visits to the UK between 1979 and 1999. Additionally, the most popular country among the British tourists was France, with well over 10 million visitors in 1999.
According to the line graph, the figures for overseas citizens stood over 10 million during 1879 and 1984 with a small increase of 1 million while the number of travels from the UK rose from around 12 million to just under 20 million over the same period. After 1984, the number of travels to and from the UK went up dramatically to 25 million and 52 million respectively.
On the other hand, France and Spain were chosen most by British people while three other most popular countries, namely Turkey, Greece, USA, were visited by around 3 million British tourists in 1999.
Word Count: 185
Thank you for your feedbacks and comments!

travel_graph.jpg
