Carlangas
Nov 23, 2015
Writing Feedback / IELTS academic task 1-target 8 score- World Population. [2]
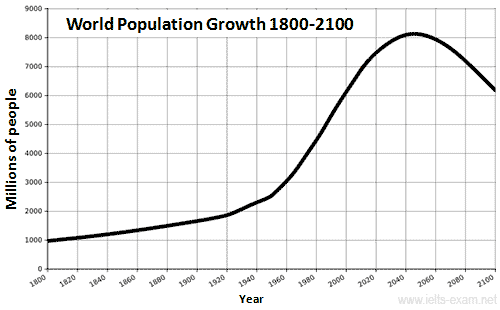
The line graph shows the world population growth from 1800 to 2100. In 1800, world population stood at 1000 million people, figure that rose slowly but steadily until 1920, when it reached 2000 million people. After 1920, the growth rate increased remarkably, it was maintained to date. Moreover, it is expected to be prolonged until 2040, when it is predicted that the world population will reach its peak of 8000 millions, hence being eight times larger than it was in 1800. Afterwards, global population is predicted to decline, lowering to slightly above 6000 million people in 2100.
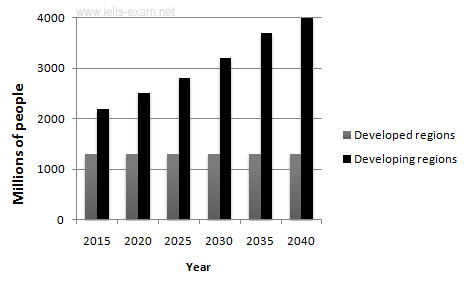
On the other hand, the bar graph illustrates the growing forecasts for developed and developing regions from 2015 to 2040. Overall, it can be seen how developed regions will stay at the present 1300 million people within all this period of time, whereas developing regions will constantly grow in inhabitants, rising their total population from the current 2200 million people to 4000 in 2040.
On the whole, while the line graph predicts that the world population will increase significantly from 2015 to 2040, the bar graph displays the fact that this growth will not be evenly in all countries.
196 words.

Line graph
Bart chart
