Writing Feedback /
IELTS Academic - Task 1 - review my writing relating to fast food consumption in Australia [7]
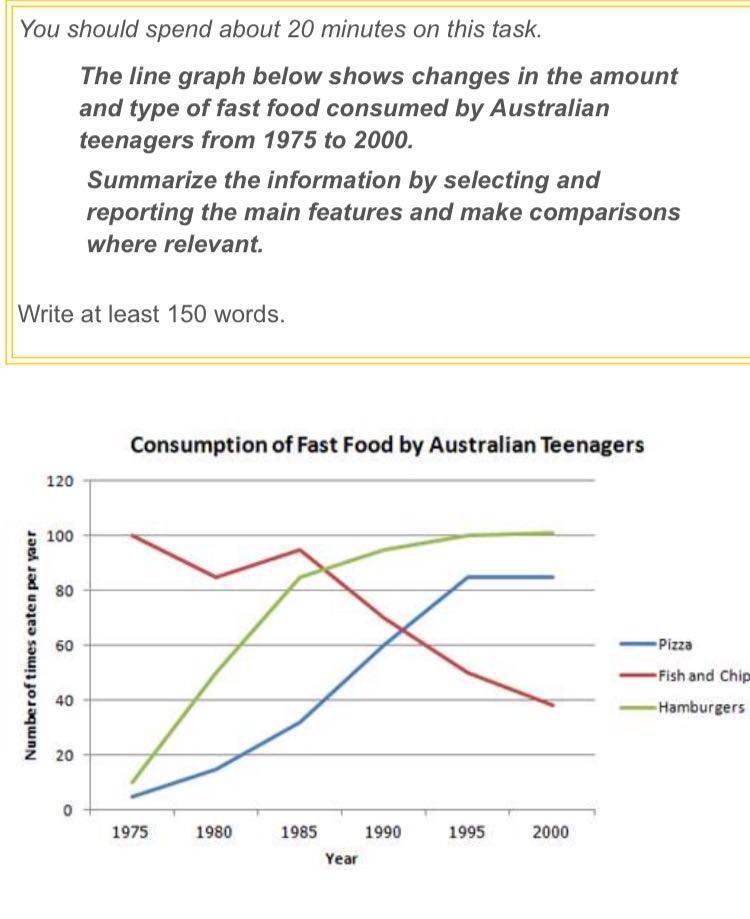
"The given line graph displays the trends of consumption of different types of fast foods by teenagers from Australia between 1975 and 2000. The overall trend shows that more numbers of hamburgers and pizza were eaten in 2000 than in 1975 but when it comes to Fish and Chip, the intake of it by teenagers went down in the span of 25 years.
In 1975, Fish and Chip were consumed 100 times by Australian teenagers and it stood at the top in terms of popularity whereas hamburgers and pizza were eaten less than 10 times annually.
Thereafter, the consumption of pizza and hamburgers grew steadily until 1995. It can be seen that the growth in terms of eating stopped for Pizza in 1995 and there was hardly any change until 2000. In contrast to data relating to Pizza, hamburgers showed continuous increase in popularity even after 1995. In 2000, hamburgers were the most popular fast food and were consumed almost 20 times more than pizza.
With respect to fish and chip, it lost the ground after 1985. The fall was very significant and steep from 1985 to 2000. Fish and Chip was eaten less number of times by the year 1980 if we compare the consumption data of 1980 with that of 1975.Though it showed a slight rise in the span of 5 years until 1985, the intake nosedived therefrom. In 2000, it was consumed barely 40 times in a year."

changes_in_the_amoun.jpg

