kzvrinv
Jun 8, 2016
Writing Feedback / IELTS Task 1. The graph below gives information about the number of cases of diarrhea in Mashhad bet [2]
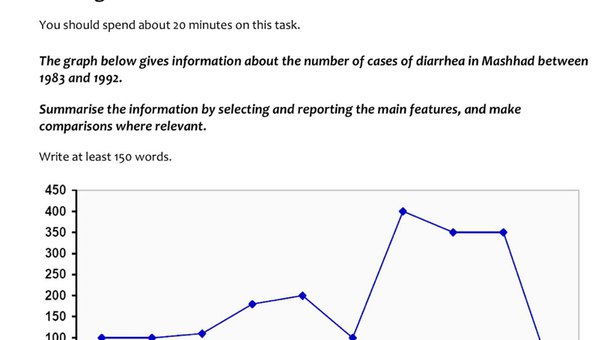
The provided illustration represents information on the frequency of diarrhea in Mashhad over a period of 9 years.
It is observed that statistics remained relatively stable between 1983 and 1985 making up 100. This was followed by noticeable rise approximately by 90 in 1986. Then, there was a slight growth to 200 the following year. It is seen that the number of people experienced diarrhea dropped back significantly to 1985's levels in 1988. However, this downward trend was suddenly broken and rose tremendously to 400 reaching the highest peak in 1989. The number of Mashhad's ill people declined by 50 in 1980 and maintained the same level the next year.
Ultimately, Mashhadians were totally rescued from the illness in 1992.

Qwtk2B2ziJE.jpg
