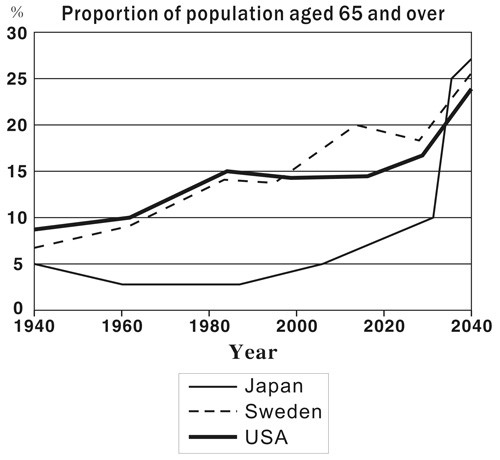
The graph line provides information about the population aged 65 and over between 1940 and 2040 in three countries: Japan, Sweden and the USA.
These countries are upward trends in the population aged 6 and over during that period. The both of Sweden and the USA increase steadily despite of the USA decrease constanly from 1980 to 2020 and then increase to 2040 at approxiately 26 percent. Beside that the rise of Japan more remarkable than the USA and Sweden. With only 5 percent from the begining of the observe, it decreases continuosly to under 5 percent during period from 1940 to early 1980s, afterward rise sharply, in particular at early 2030s it is forcasted that will increase from 10 percent to about 27 percent at 2040.
In conclusion, the chart distingiush surpassing of Janpan to the USA and Sweden to occupy the first place in the people aged 65 and over.
p/s: the first time i've posted so hope you guys help me to improve my writing skill.

the chart line
