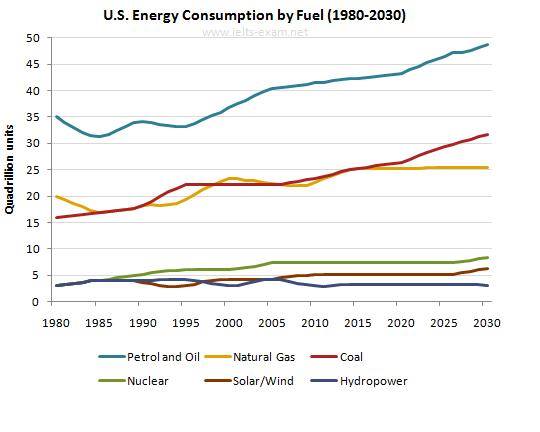
The graph below gives information from Annual Energy Outlook 2008 about consumption of energy in the US since 1980 with projection until 2030
The line Chart bellow illustrates the information about the consumption of energy in the USA between 1980 and with projection 2030 based on Annual energy outlook and is measured by quadrillion units. Overall, it is important to notice that energy consumption from Petrol and oil still dominant which is compared with the others in over the frame period. In other hand, the figure of hydropower energy consumed still remains stable.
Moving to a more detail analyze in non-renewable energy category such as Petrol oil, Natural gas, and coal, to begin, in 1980 the number of consumption energy from petrol and oil stood at 35 quadrillion, this was the highest compared Natural gas at 20 quadrillion units and coal at approximately at 16 quadrillion units. Even though almost the energy consumption in sector non-renewable energy had time to decline steadily in 1985. After that, the general trend figures of the energy consumption from non-renewable energy have been increasing significant until 2030. The peak consumption will reach in 2030 where petrol and oil will stand at less than 50 quadrillion units, coal at approximately 27 quadrillion units, and natural gas at about 25 quadrillion units. However, the amount of energy consumption from Petrol and Gas will be highest compared with others.
Turning to renewable energy, all of the figures showed the energy consumption stood at less then 5 quadrillion units in 1980. Next the number of energy consumption from solar and hydropower have been fluctuating smoothly and those will estimate for reaching on the top consumption in 2030 which the amount of energy consumption from solar at about 6 quadrillion units and hydropower at about 3 quadrillion units. How ever, the energy consumption from nuclear will reach at approximately 9 quadrillion units in 2030. This will be highest in renewable category
the energy consumption
The line Chart bellow illustrates the information about the consumption of energy in the USA between 1980 and with projection 2030 based on Annual energy outlook and is measured by quadrillion units. Overall, it is important to notice that energy consumption from Petrol and oil still dominant which is compared with the others in over the frame period. In other hand, the figure of hydropower energy consumed still remains stable.
Moving to a more detail analyze in non-renewable energy category such as Petrol oil, Natural gas, and coal, to begin, in 1980 the number of consumption energy from petrol and oil stood at 35 quadrillion, this was the highest compared Natural gas at 20 quadrillion units and coal at approximately at 16 quadrillion units. Even though almost the energy consumption in sector non-renewable energy had time to decline steadily in 1985. After that, the general trend figures of the energy consumption from non-renewable energy have been increasing significant until 2030. The peak consumption will reach in 2030 where petrol and oil will stand at less than 50 quadrillion units, coal at approximately 27 quadrillion units, and natural gas at about 25 quadrillion units. However, the amount of energy consumption from Petrol and Gas will be highest compared with others.
Turning to renewable energy, all of the figures showed the energy consumption stood at less then 5 quadrillion units in 1980. Next the number of energy consumption from solar and hydropower have been fluctuating smoothly and those will estimate for reaching on the top consumption in 2030 which the amount of energy consumption from solar at about 6 quadrillion units and hydropower at about 3 quadrillion units. How ever, the energy consumption from nuclear will reach at approximately 9 quadrillion units in 2030. This will be highest in renewable category

line_chart_copy.jpg
