The graph below show the consumption of 3 spreads from 1981 to 2007 Summarize the information by selecting and reporting the main features and make comparisons where relevant.
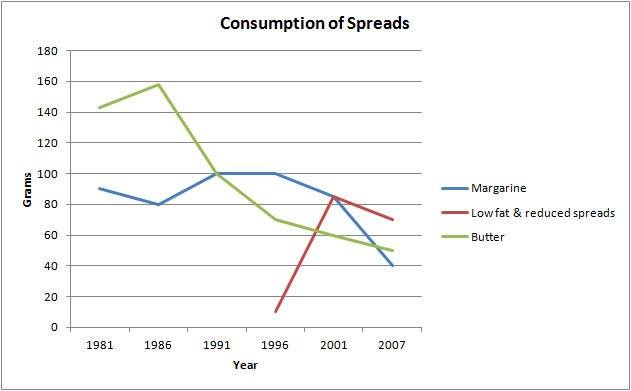
The line graph shows the information about the consumption of 3 spreads from 1981 to 2007. Overall, there are three spreads: margarine, low fat & reduced spreads and butter. It is noticeable that butter was the most popular of the three spreads in 1981.
Between 1981 until 1986, Butter consumption increased from around 140 to a peak 160 grams per year. During the same period, consumption of margarine decreased from around 90 to 80 grams per year while low fat & reduced spreads had not consumed yet until 1996.
By 2007, butter had significant descended since the first year. The highest consumption of spread is low fat and reduced spreads that had significant rose since the 1960's, to approximately 70 grams per year. The second place, occupied by butter with approximately consumption 50 grams per year. The lowest consumption of spread is margarine with average consumption 40 grams per year.

Line chart
