Unanswered [7] | Urgent [0]
  

Home / Writing Feedback   % width   Posts: 4


The given graphs compare the percentage of five used sources of energy consumed in the USA - IELTS 1


tuitenhuy 1 / 1  
Oct 29, 2020   #1

The main sources of energy in the USA in 1980 and 1990


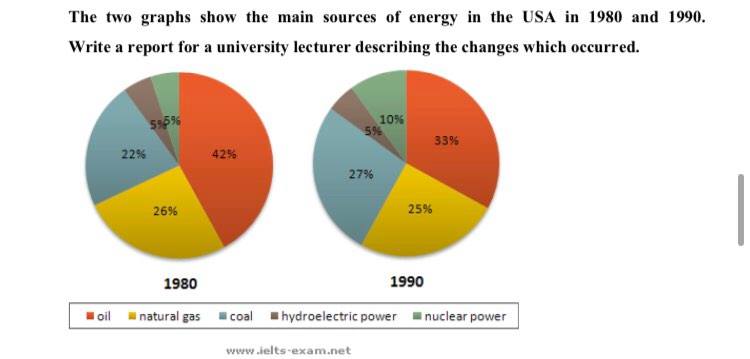
The given graphs compare the percentage of five used sources of energy consumed in the USA in 1980 and 1990. Overall, the consumption of oil dominating other sources in energy industry could be seen at the first glance. While, there was not much changes in the proportion of other categories.

In 1980, oil contributed 42% and was the best choice for sources of energy. The second and third highest figures were from natural gas and coal, with 26% and 22% respectively. After 10 years, the rate of oil remained the most reliable type of energy, yet decreased by 9%. Coal appeared to be the second highest percentage (27%) at the expense of oil. However, the proportion of natural gas was virtually the same, which decreased to 25%.

The source of energy produced from nuclear power was taken more consideration after one decade, which the proportion doubled to 10% in 1990. However, the percentage of used hydroelectric power remained the lowest figure accounting for 5% compare to other categories in two given years

  • 122905495_3617364850.jpg


Holt  Educational Consultant - / 15393  
Oct 30, 2020   #2
You did not bother to change the chart description in your presentation. You need to change that to a description totally different from the original presentation. In the original, the phrase "The given graph" was used. In your version, this should be a specific image description; "The divided pie charts..." so that the reader will know the exact image being presented. You need to show the examiner that you actually know the types of images used in research as a part of your analytical prowess. There needs to be a uniform 3-5 sentence per paragraph. Otherwise, the information you present in the under served sentence paragraph will be seen as incomplete, under developed, or little explained.
ngocmaing 3 / 6  
Oct 31, 2020   #3
As there are a review about your overall writing, I would just give some feedbacks about small grammar details you should pay attention. These mistakes may be small but they can cost you lots of point as grammar accuracy must always be on point while writing IELTS task 1.

1, "... of oil dominating the consumption of other sources ..."
2, "yet decreasing by 9%"
3, this sentence is quite odd. I would suggest this:"However, ... the same as it only decreased about 1% over a span of 10 years."
OP tuitenhuy 1 / 1  
Nov 1, 2020   #4
Thank you guys so much! I will fix all my errors.
So, Could you guys let me know the band score of my essay?

Please make your thread URGENT or consider our private review services to receive a detailed band score explanation for your essay. Scoring is not part of the free service. Thank you.


Home / Writing Feedback / The given graphs compare the percentage of five used sources of energy consumed in the USA - IELTS 1
Need Writing or Editing Help?
Fill out one of these forms:

Graduate Writing / Editing:
GraduateWriter form ◳

Best Essay Service:
CustomPapers form ◳

Excellence in Editing:
Rose Editing ◳

AI-Paper Rewriting:
Robot Rewrite ◳

Academic AI Writer:
Custom AI Writer ◳