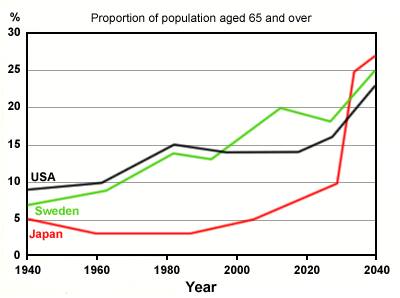
The line graph provides of the quantity of population 65 years and over, according to the percentage from 1940 to 2040 year in three cities. It is apparent from the information that, although Japan was the lowest member in the first period in 1940 while over 100 years later it will be the highest percentage of people 65 ages and next.
Looking detail on the data, Japan stood at below 5 percent of people 65 years in 1940. Moreover, in 1960, it slightly decreased to below 5 percent. Then, the line was steady twenty years later. in addition, a total population in Japan increased gradually between 1980 to 2000, in which approximately in the middle of 2030, the percentage will increasing dramatically and peak in 2040 around 27 percent.
On the other data, Sweden and The USA, both of them stood at below 10 percent in 1940, in which they had similar rate and fluctuation until 60 years later. However in the middle 1980, they were separated in which Sweden increased gradually until 2040 even though had experienced decreased in 2010 but it will be growing over in 2020. In contrary, USA will have stabling rate until in 2020 then, it is increasing and finish in 2040.

homework.jpg
