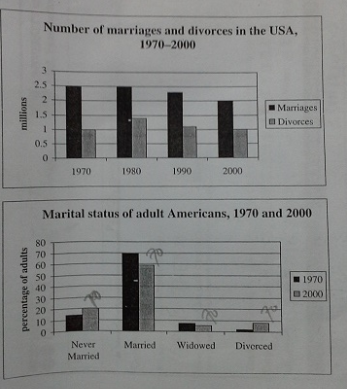
The charts below give information about USA marriage and divorce rates between 1970 and 2000, and the marital status of adult American in two of the years.
Summarize the information by selecting and reporting the main features, and make comparisons where relevant.
The bar charts illustrate about the number of marriages and divorces in USA from 1970 to 2000, and the marital status of adult Americans in1970 and 2000. At first glance, it is evident that the number of marriages in USA is higher than divorces over frimetime. Then, for marital status of adult Americans, married resulting the higher position than other marital status.
To begin with, in 19970 until 1980, the number of marriages was stable at 2,5 million while divorce was increased slightly at 1 million to around 1,4 millions in two of years next two decades the number of marriages saw decreased significantly at approximately 2.4 millions and 2 million respectively.
Moving to a more detailed analysis from the bar charts reveals that the percentage of adults for never married status stood at around 11 per cent, and reaching a peak at 70 per cent for married status, it decreased slightly at some 5 per cent to widowed, approximately 2 per cent for divorced in 1970.

TASK1_scoring7.PNG
