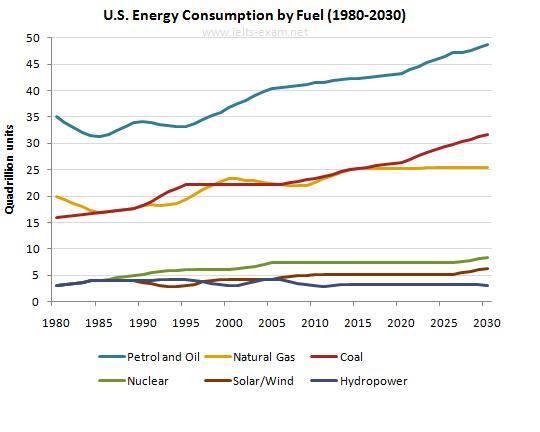
The graph below gives information from Annual Energy Outlook 2008 about consumption of energy in the USA since 1980 with projection until 2030.
The line chart shows the number of forecast consumption energy by six different varieties of fuels in USA based on experience of applying energy in 2008, between 1980 and 2030 and measured by quadrillion units (qu). Overall, it is important to note that Petrol and Oil will be projected as the main sources of energy. Natural Gas and Coal have had the similar number demand of energy whereas Nuclear, Solar and Hydro have been the least energy provider.
To begin, the number energy of Petrol and Oil were stood at 35qu in 1980, which is almost double than two source energy else, Natural Gas at 20qu and coal at 15qu. Despite there was a fluctuation in the beginning, Petrol and Oil experienced a significant increase in their energy and will expected approximately at 49qu in 2030. Followed by Natural Gas and Coal had almost same pattern. Though coal had some fluctuation until 2010 but from then it started to rise and expected to be labeled off and will finish the period at 25qu unit. However, natural gas rose gradually from 1980 and predicted to continue this trend up to 2030 and will exceed the level of 30qu of energy.
On the other hand, Solar/Wind, Nuclear, and Hydropower were the least-used types of energy sources and will remain the same throughout the time period. However, Nuclear and Solar showed a slight increase and will continue to rise slowly until 2030.

line_chart.jpg
