Unanswered [1]
  

Home / Writing Feedback   % width   Posts: 3


The proportion of Coca-Cola sales around the World - IELTS Task 1


frankie89724 1 / -  
Jul 22, 2017   #1

sales and share prices for Coca-Cola


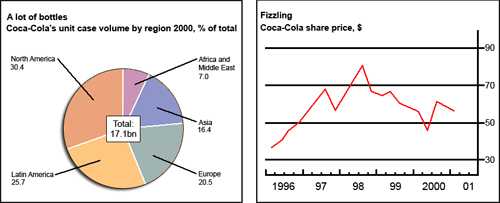
the pie chart illustrated that the proportion of Coca-Cola sales around the World.According to the diagram,17.1 billion Coca-Cola sold in 2000.North America is the largest market for Coca-Cola,constituting 30.4%.the second largest market is Latin America,which occupied 25.7% of the sales.In addition,Sale in Europe and Asia is the third and fourth largest market which devoted 20.5% and 16.4% sales.Africa and Middle East purchased 7% of the total amount of Coke,which is the smallest market around the world.

The line chart demonstrated that the share price of Coca-Cola in stock market.After a glance,Generally, the price raised between 1996 and 2001,though line fluctuated .In 1996,the price was around 32 pound.In 1998,the share value raised 43 dollar,came to 75 dollar per share.After 1998,the price decrease gradually.Each share descended to 52 dollar in 2001.Overall,price rose 20 dollar between 1996 and 2001.(139 Words)

The chart and graph below give information about sales and share prices for Coca-Cola.
Write a report for a university lecturer describing the information shown below.

  • Data


Holt  Educational Consultant - / 15460  
Jul 22, 2017   #2
Cheung, please pay attention to the English writing rules when you write your essays. Follow the "first word is always capitalized" rule as that is a standard requirement for all English written activities, not just essays. The minimum standard for the task 1 essay is 150 words. So, unless you forgot to mention that there was a lower word count requirement for this essay, you are under the word minimum count and will receive a penalty for it. You could have increased the word count if you had bothered to deliver a proper summary of the report. That is something that is required of all Task 1 essays and can be placed either at the beginning or the end of the essay. You did not place a summary anywhere. You went directly into the discussion of the illustration without offering a proper overview summary of the discussion for the reader to serve either as the opening or concluding statement of the essay. You only have 2 paragraphs in this essay when the minimum presentation is 3 paragraphs. There are really several shortcomings in your current presentation that will prevent this essay from garnering a passing score, at the very least, during the actual test. With regards to your graph analysis, since the figures provided are estimates, you should make sure to always use terms such as estimated, about, close to, and other similar terms to connote that the figures you are providing are only close to the graph but not the actual figure. It is extremely difficult to claim an actual figure in this case because the graph lines did not fall on the actual number, but always somewhere in between. Therefore, the presentation must be as close to an estimation as you can get of the actual figure. Be consistent about that presentation. Don't suddenly sound sure because the image was unable to provide you with accurate information.
hi021132 6 / 11  
Jul 23, 2017   #3
@frankie89724
I think you have to be more careful when describing the trend.

You need the preposition to indicate the change of the curve.
[In 1998,the share value raised 43 dollar,came to 75 dollar per share]
This sentence should be [In 1998, she share value raised by 43 dollar, came to 75 dollar per share

Another point is that you can use hedging instead of quoting the exact number. There is risk to quote a number but it is inaccurate.

I hope these can help.


Home / Writing Feedback / The proportion of Coca-Cola sales around the World - IELTS Task 1
ⓘ Need Writing or Editing Help?
Fill out one of these forms for professional help:

Best Writing Service:
CustomPapers form ◳

Graduate Writing / Editing:
GraduateWriter form ◳

Excellence in Editing:
Rose Editing ◳

AI-Paper Rewriting:
Robot Rewrite ◳